
Power BI and VSTS Analytics
We have been working hard to improve the integration between VSTS Analytics and Power BI. We are happy to announce we’ve released the first step in doing so.
The VSTS Power BI Desktop Connector has been updated to provide additional options for historical trend and bug analysis. Please refer to our guidance on connecting to VSTS with Power BI Data Connector
The additional options are available when you download the January, 2018 release (or later) of Power BI Desktop.
However, this is just the first step! While it may appear we are only providing a few more options, we have completely reengineered the way Power BI pulls data from VSTS Analytics.
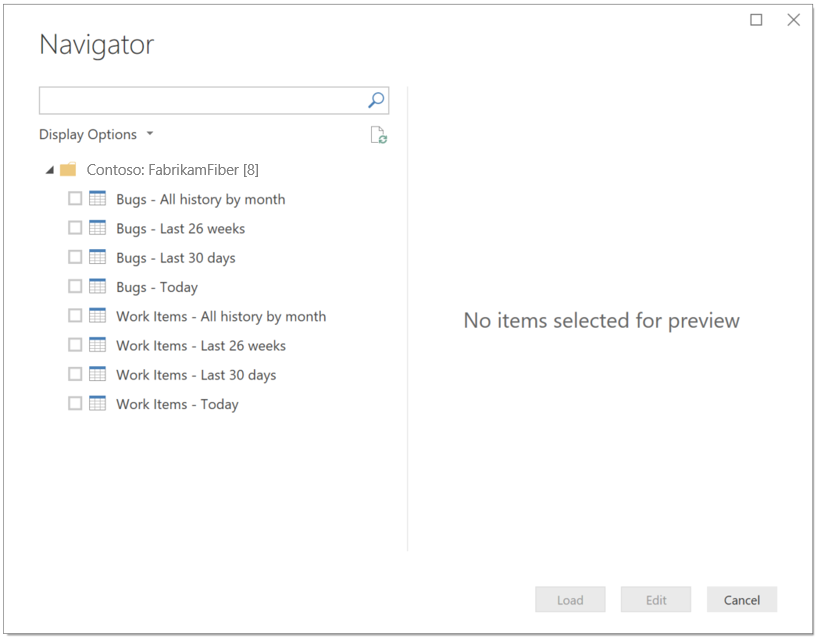
Each of the options (e.g.: Bugs – Last 26 weeks) are views exposed by the VSTS Analytics service. Each view defines what data and history will be returned to Power BI. Currently, these views do not filter. For large accounts, they may return more data than Power BI can load.
In February, we will provide the ability to create your own views. With each view, you can define what data and history is loaded into Power BI. You will be able to filter by team, work item types, and provide additional filter criteria. The VSTS Data Connector in Power BI will allow you to select customized views. Only data matching the view’s filters will be loaded into Power BI.
Before, Power BI could only get a filtered data set from VSTS Analytics if you knew how to write OData queries. With customizable views, tapping into the power of Power BI will get a whole lot easier!
We can’t wait to provide this functionality. Stay tuned. We’ll publish a blog post here when its available.
 Light
Light Dark
Dark
0 comments