
Velocity Widget available for the VSTS Analytics Extension
The Velocity Widget is now available for those who’ve installed the Analytics Extension on their Visual Studio Team Services (VSTS) accounts.
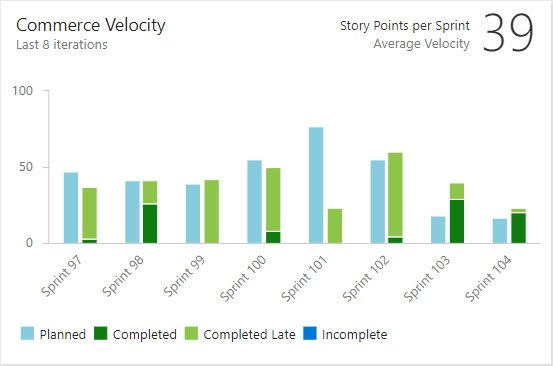
The Velocity Widget provides functionality not available in the Velocity Chart displayed on the Backlog view, such as:
- Show velocity for any team, not just the current team
- Show velocity for any backlog level or work item type, not just the Stories backlog.
- Calculate velocity by sum of any field, not just Story Points. Or, by count of any work item type.
- Show planned vs. actual. Did you deliver what you actually planned?
- Highlight work that was completed late, after the sprint
- It supports sizing to 1×1, for when you just want a tile to show your average velocity:

If you haven’t already, install the Analytics Extension to get access to the Velocity Widget as well as widgets for Lead Time, Cycle Time, and a Cumulative Flow Diagram.
We will be publishing more widgets for the Analytics Extension in the coming months, such as Burndown, Burnup, and Trend. Look for those in upcoming release notes.
Enjoy!
 Light
Light Dark
Dark
0 comments