
Cloud-load testing: rich reports in the web
As perf. engineers run load tests, they not only want to analyze a load test run, but also obtain a quick overview of the key metrics, identify problem areas to focus on, view diagnostic information to analyze failures, etc. In addition, when their application changes, they want to compare load test runs to understand if the app changes have caused any performance regressions or have led to the desired improvements. And, last but not the least, the ability to share load test results with the team is important too!
Over the last few sprints, we have added rich reporting capability in the web, so that when you run a cloud-load test, you can do all the above effortlessly. Whether you have run a test using Visual Studio IDE or run an Apache JMeter test using the portal, the rich reports are available for all types of tests. This blog covers some of these capabilities.
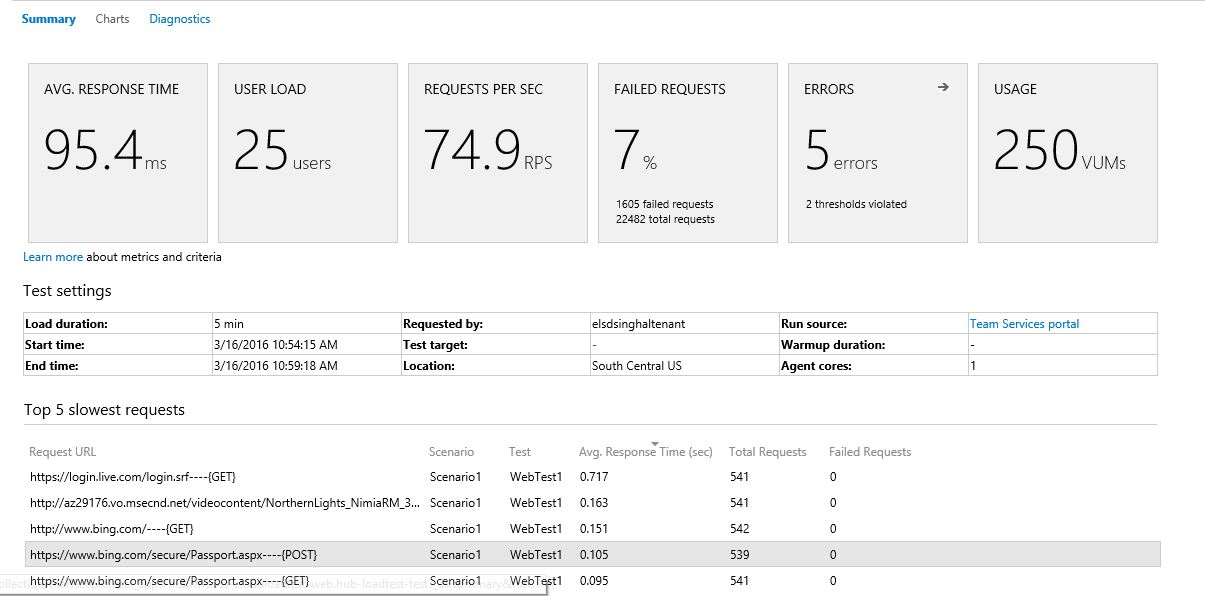
- Load test run report – This report includes the key performance indicators such as Avg. response time, RPS, failed requests, etc. in the ‘summary’ view. The ‘charts’ tab contains the charts for performance and throughput indicators for your load test, while the ‘diagnostics’ tab provides insights into any test errors and important status messages from the load test service that may have occurred during the load test run. Load test run report is available for viewing not only after the load test run is completed, but you also get to see these metrics ‘live’ when the load test is running.

Once the load test completes, you also get to see the “Top 5 slowest requests” and “Top 5 slowest transactions” for your test, as applicable. This helps you quickly identify the problem area to focus on. Pick the top slowest request or transaction that’s critical to your app and focus on improving the response / transaction time to improve the performance of your app.
2. Compare two load test runs: Want to compare your current load test run to a previous run that represents the baseline? You can simply pick the two runs and compare them to know if the new run fared better than the previous one.

A quick glance at the key metrics tells you whether performance improved or regressed. You can also compare perf. data over the course of load test execution, in the chart.
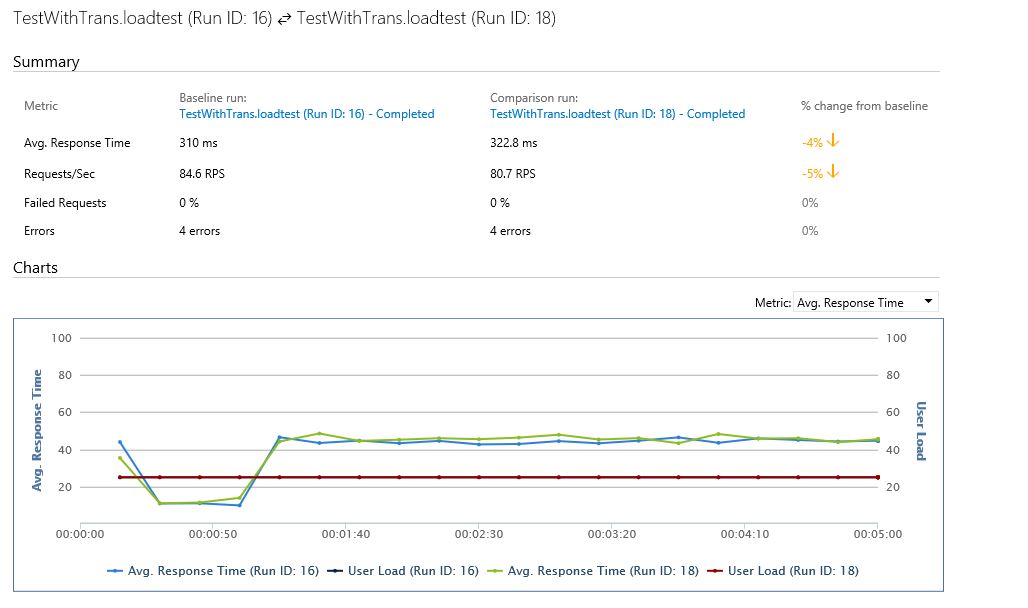
3. Share the results with your team: These reports are available in the VSTS portal, so your team members can also view it. Just share the URL of the comparison report you generated.
Go ahead, try it out and share your feedback. You can reach us at vsoloadtest@microsoft.com
 Light
Light Dark
Dark
0 comments