Collect data from a windows service using the IntelliTrace Standalone Collector
In this blog post I am going to walk you through how to collect data from a windows service using the IntelliTrace Standalone Collector. For the purpose of this post I will be using a windows service I created called “MyWindowsService”.
Note: If you already have Visual Studio installed on the machine the windows service is running you don’t necessarily need to follow this guide because IntelliTrace now supports attach! Simply attach to the running windows service using Visual Studio and IntelliTrace will start collecting data and showing it in the Diagnostic Tools window just like it does when you debug using F5. The only caveat is that you cannot collect calls information when you are attaching, you can only collect events. If you want to collect calls information you’ll need to follow this guide instead.
Step 1 – Download the IntelliTrace Standalone Collector
Download the latest version of the IntelliTrace Standalone Collector. Don’t worry about the version of Visual Studio you have, it’s backwards compatible. What you get is a self-extracting .exe file and if you run it you will get an IntelliTraceCollection.cab file copied to a folder of your choice. I chose the folder C:IntelliTrace.
Step 2 – Extract the .cab file
Use the following command to expand the .cab file (yes, the dot at the end is necessary):
**expand /f:* IntelliTraceCollection.cab . **
I used the above command to extract everything into the directory C:IntelliTrace.
Step 3 – Configure your collection plan XML file
The collection plan is the compilation of all settings that tell IntelliTrace what data to collect while the windows service is running:
- What interesting events to collect
- Whether to collect method calls and parameters
- Whether to whitelist or blacklist certain assemblies
The .cab file contains two collection plans out of the box:
- collection_plan.ASP.NET.trace.xml: Equates to the default IntelliTrace setting in Visual Studio, which means it will collect only events (not method calls) and not the complete list.
- collection_plan.ASP.NET.default.xml: Equates to selecting “IntelliTrace events and call information” from the General tab of the IntelliTrace options in Visual Studio.
Pick whichever of the two files sounds like a good starting point and make whatever changes you need. I recommend starting with the first one since collecting both events and call information adds considerable overhead. You can make the changes either using a community tool or by editing the XML file manually.
Step 4 – Specify the directory you want IntelliTrace to save its data in
You need to make one final edit to your collection plan that unfortunately has to be done manually by editing the XML file:
- Open the XML file in your editor of choice
- Find the XML element “LogFileDirectory”
- Give it a value, for example:
C:Logs
That’s the path to the directory in which IntelliTrace will save as an .itrace file all of the data it collects. You must make sure that the user the windows service is running as has read and write access to this directory.
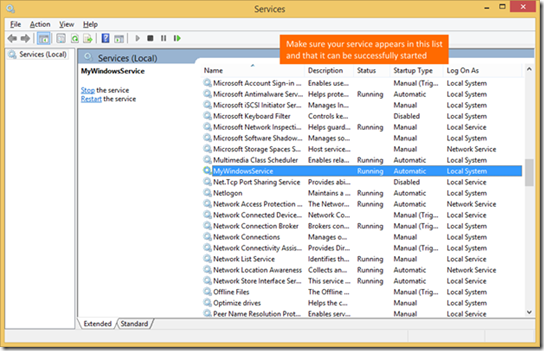
Step 5 – Register your Windows Service and make sure it starts
Register your Windows service on the target machine so that it shows up on the list of services available and make sure it can be started successfully:

Step 6 – Edit the registry
Using RegEdit navigate to the key HKEY_LOCAL_MACHINESYSTEMCurrentControlSetservicesMyWindowsService and create a new Multi-String Value called “Environment”

Double click on it and set its value to be the following:
COR_ENABLE_PROFILING=1
COR_PROFILER={AAAAAA70-DFED-4CB4-A1D6-920F51E9674A}
COR_PROFILER_PATH=Microsoft.IntelliTrace.Profiler.14.0.0.SC.dll
VSLOGGER_CPLAN=
Note: If you are trying to collect from a 64bit service, the COR_PROFILER_PATH must point to the 64bit version of the dll, which is in the subdirectory “x64”. For example: “C:IntelliTracex64Microsoft.IntelliTrace.Profiler.14.0.0.SC.dll”
You must make sure that the user the windows service is running under has read and write access to both the directory the collector’s DLL is in, as well as the directory containing the collection plan XML file. As you can see in the screenshot above I used the directory C:IntelliTrace for both. Also make sure the name of your collection plan XML file is correct, I used “CollectionPlan.xml”.
Step 7 – Restart your windows service
You are all set. As soon as you restart your windows service IntelliTrace will automatically start collecting data from it. As soon as you stop your service you will find one or more .itrace files in the log directory you specified during the previous step (I used C:Logs). You can now open the .itrace file using File > Open > File… in Visual Studio to see what IntelliTrace has collected.
Wrapping up
We are always looking for feedback and comments for our features. You can leave general comments & questions at the end of this blog post or via Send-a-Smile, and submit feature requests to our IntelliTrace UserVoice. You can also send us a tweet or visit the MSDN Diagnostics forums.

 Light
Light Dark
Dark
1 comment
Hi Angelos, I know this is really old post but is there any latest blog or documents available for using IntelliTrace Standalone Collector? As I am failing to get this working for windows service built suing .net core.Do I need to use any different version or Microsoft.IntelliTrace.Profiler.14.0.0.SC.dll is this the current one ?Help will be really appreciated.Thank you.