Code maps now differentiate test projects, and bring code context into map elements
Today Soma announced the Release Candidate of Visual Studio 2015. It adds two useful improvements to the Code Maps feature, which can make it easier to create better designs and architectures for your applications. The first improvement is in the way that code maps display and interpret test assets within solutions. The second improvement is in the way that the context of your code is carried through into the elements on the map.
Test project differentiation
In Visual Studio 2103, test assets (such as test projects and classes) are displayed in exactly the same way as other types of code items. For example, the following screenshot shows the code map generated for a solution in Visual Studio 2013. To make it easier to see the contents, we used the Layout menu in the code map toolbar to show the map in Quick Clusters Layout.
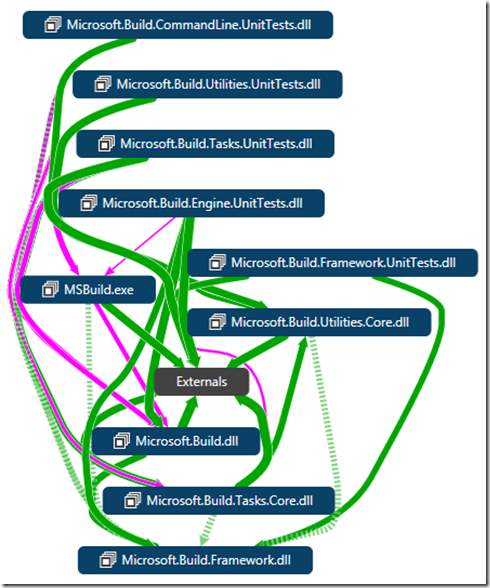
This post demonstrates the //build conference version of Visual Studio 2015. The UI and the menu commands are likely to have changed a little in the final release version.
**
However, in Visual Studio 2015, code maps now differentiate test assets and display them with a new style. The following screenshot shows the same solution and layout in a Visual Studio 2015 code map. You can see the new style in the map and on the Legend panel.

Visual Studio automatically identifies Microsoft Test (MSTest) assets. It also identifies and categorizes as test assets any code from other test frameworks for which you have installed the respective adapters.
In addition, the Filters pane (shown by clicking the Filters button in the code maps toolbar) now contains a Test Assets checkbox that allows you to show or hide test items. This means you can quickly and easily simplify the map, and focus on specific items of interest.
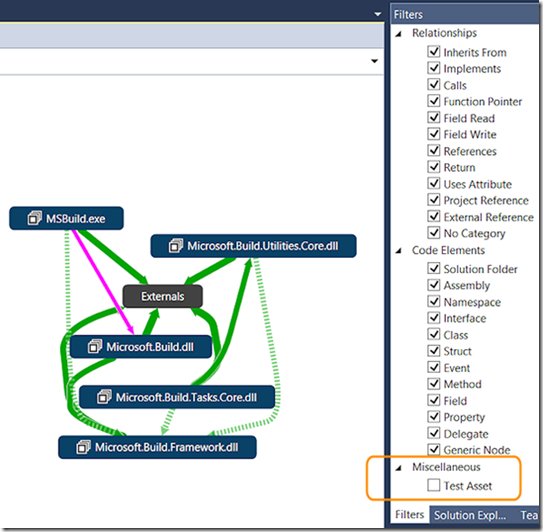
Code context improvements
The second improvement in this release of Visual Studio 2015 is the way that the context for code items is carried through into the code elements of a map. To see how this feature makes code maps more useful, the following example shows the difference between the experience in Visual Studio 2013 and Visual Studio 2015.
In this example, we want to make a change to some code within our solution. The code we need to change is an enumeration called LinkStatus, and we want to know before we start what impact this change could have on the solution as a whole.
The VS 2013 experience…
In Visual Studio 2103, the first step is to open the source code file and select the code element we want to change. Right clicking opens the context menu, and we can select Show on Code Map.

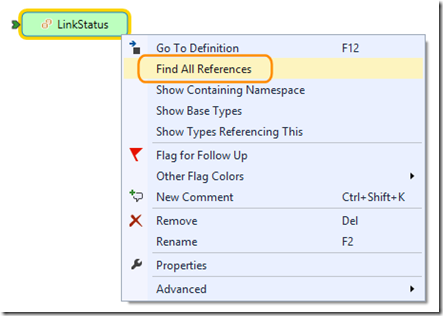
Visual Studio shows a new code map containing just our LinkStatus enumeration item – notice that there is no context shown for this item. However, right clicking allows us to select** Find All References**, which will provide the information we need to see the impact a change will have on all the other code elements of the solution.
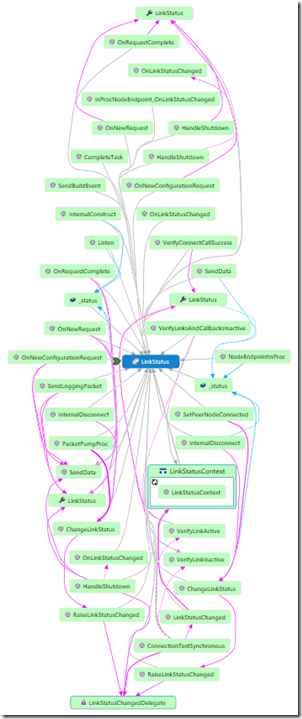
The next screenshot shows the result. Despite the fact that we had to shrink the size to get it onto the page, you can see that it’s clearly not very useful as it is.

And, even when we use the Quick Clusters Layout option on the Layout menu to get a better view of the contents, it’s not that much clearer where all the possible impacts are. All we’re seeing are the methods and properties where the LinkStatus enumeration is referenced.
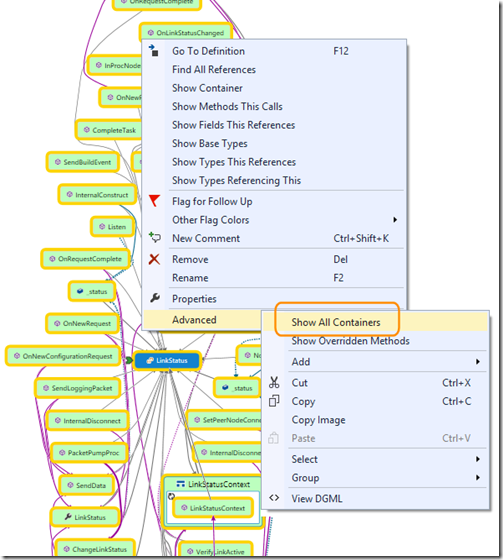
So we press CTRL + A to select all of the items on the map, right click, and choose Show All Containers.
Now, finally, we can see where the possibly impacts may occur in terms of the classes, namespaces, and assemblies.
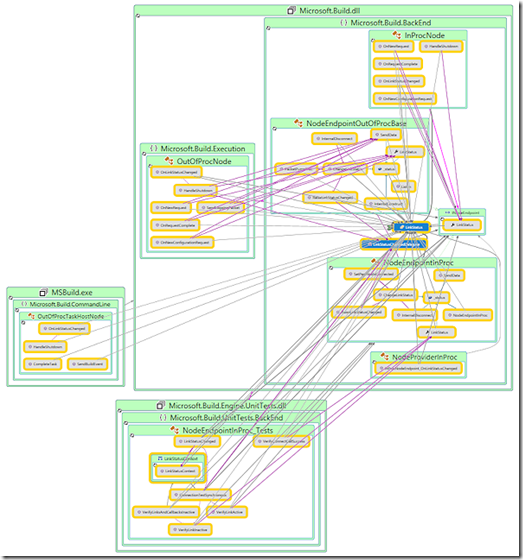
The VS 2015 experience…
Instead, let’s now see how much better the experience is in Visual Studio 2015. As before, we start by selecting the enumeration in the source code file, and showing it on a code map.
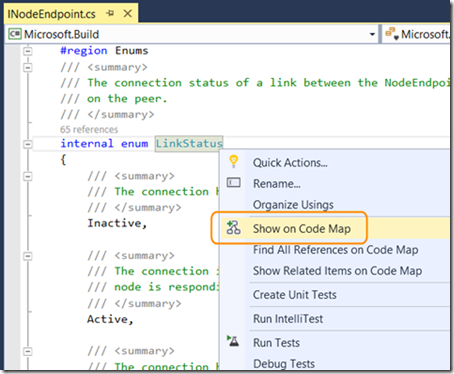
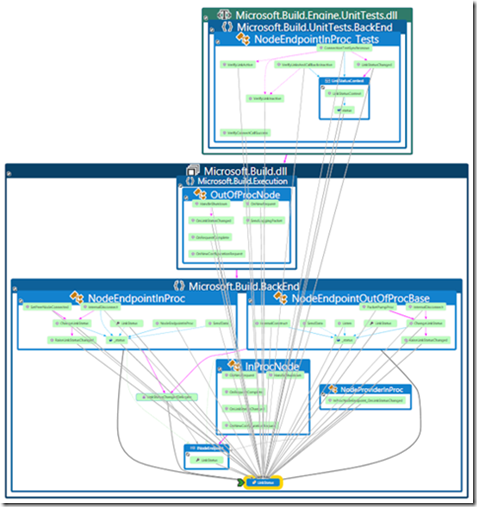
Notice that, this time, we get the context for the code element. As well as the LinkStatus node, we get the namespace and the assembly containers. From here we continue as before, by finding all references to our LinkStatus enumeration.
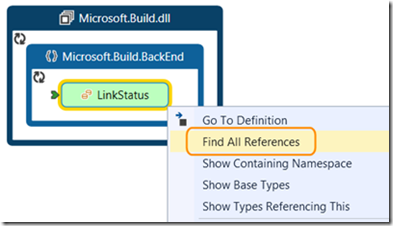
Visual Studio 2015 now displays a code map that contains all of the referencing code elements, each contained within its class, namespace, assembly, and solution folder. There is no need to go through the process of selecting them all and showing the containers, as we had to do in Visual Studio 2013.
And there’s more…
Just when you think it can’t get any better, remember the first improvement in Visual Studio 2015 we saw earlier in this post. It’s quite likely that, when we are initially modifying the code for a solution, we aren’t that worried about whether we break the tests. After all, it’s possible they will need to be updated afterwards to cover the changes to the code.
By turning off display of test assets in the Filter pane, as you saw earlier, we remove some of the items in the map. This also removes all of the reference links to these items. It considerably simplifies our code map and makes it much easier to focus on the references to our LinkStatus enumeration in the actual application code – as you can see in this screenshot.
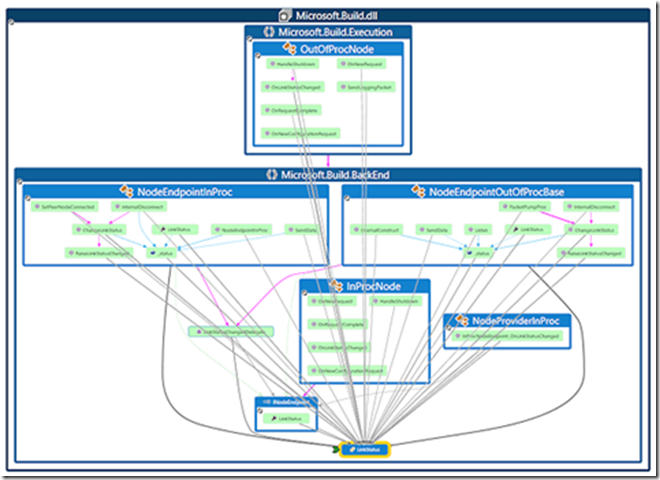
Compare this with the earlier screenshot from Visual Studio 2013 to see just how much the diagram has been simplified.
Related information
- New ways to quickly create a Code Map
- Filter link types on Code Map
- Code Map improvements in Visual Studio 2015 CTP6
- Map dependencies across your code

 Light
Light Dark
Dark
0 comments