Search your logs instantly using property filters
Our latest improvements to Application Insights Diagnostic Search include a personal favorite of mine, Property filters. While it’s easy to setup logging from your application, we don’t want you and your team to spend a lot time trying to search your logs. Property filters in the Diagnostic Search provides an at-a-glance display that helps you quickly narrow down your search.
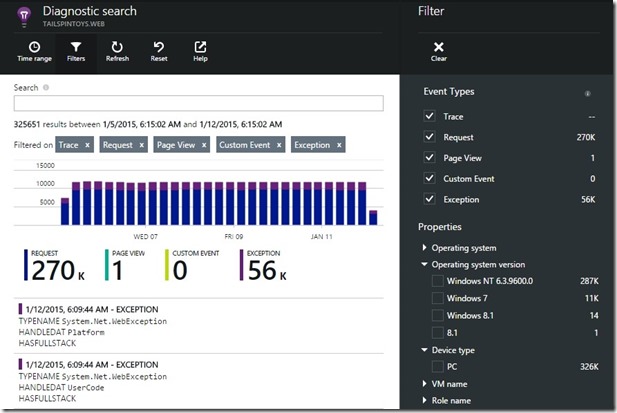
What are property filters?
Property filters provide a quick way to refine search queries, continually drilling down until you find the desired search result. These filters currently include standard properties that Application Insights SDK collects. Very soon this will also include the custom properties that you can send with each event.
In this example, I want to know why my users are complaining that a certain part of my ASP.NET application has been failing for the last few hours. It has been instrumented using Application Insights, so I can go straight in to investigate.
From the Application Insights overview blade, I open Diagnostic Search, and then the Filter blade. The properties section displays the count of search results that match each property value.
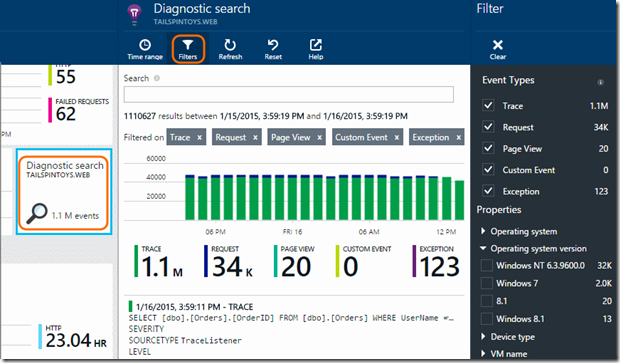
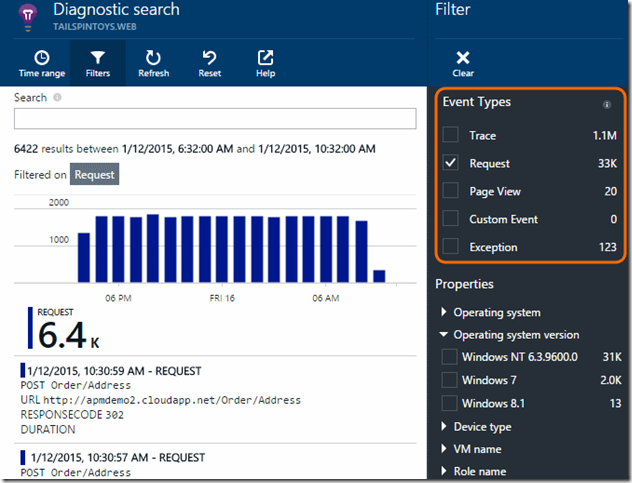
In this example I want to begin by finding the failed requests. So I’ll deselect all except the Request event type. Now both the search results and filters will be updated for request events.
The filter blade is updated to show the standard properties that Application Insights SDK collected. For example, we can see all the request names that were used in the recent period.
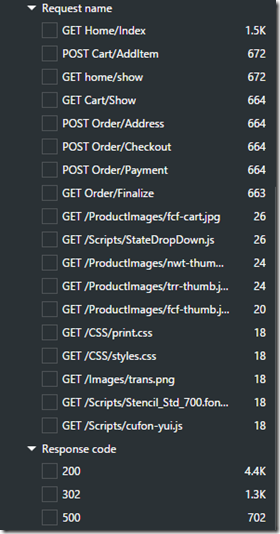
I want to see just the failed requests, so I check the Response code value 500. This updates not only the results chart and list of events on the left, but also the available property filters on the right. It’s easy now to see which requests have failed. In one click the result set is down from 6.4K to 728.
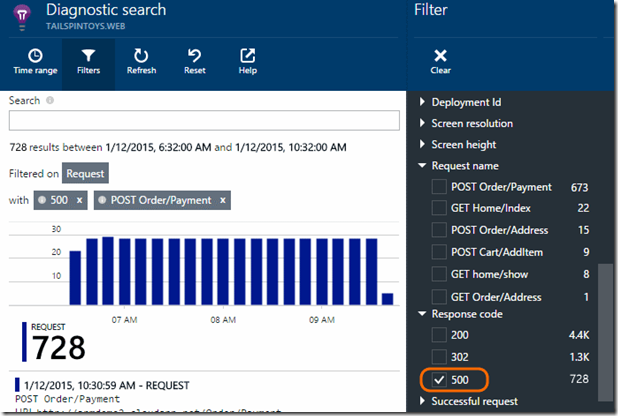
Now I’ll focus just on the POST Order/Payment request, since it shows 673 failures in the last four hours. (BTW, you can set the Time Range to any period in the past seven days.)
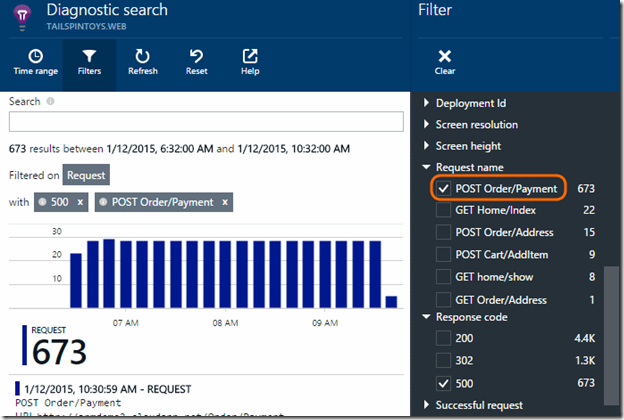
This request is clearly an important part of my app – it allows customers to pay for the products purchased. The search results are updated to show only those requests. Now I can click on any of these results to analyze why they failed.
I open one of the recent failed request in the hope of understanding the root cause for the failure. On the details blade that opens up I see one dependency failing and two exceptions. Click on one or both the exceptions to find out what really happened.
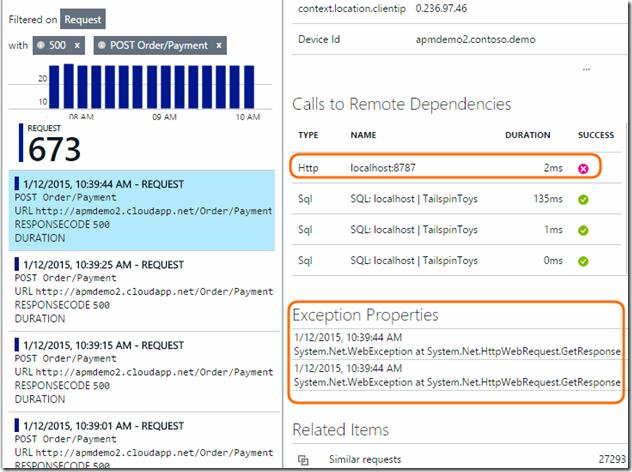
This opens up the exception details. The Call Stack shows both the top level and the inner exception which explains my credit card processor service was failing. Since it also shows me the file name and the line number where the failure happened, I can start debugging this right away.
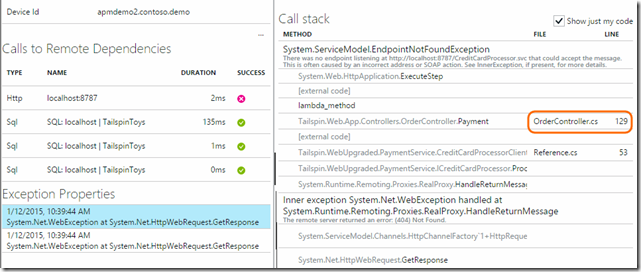
As you can see, we were able to start diagnosing an issue by using diagnostic search and property filters to quickly understand the root cause of the issue. This enables you to drill into your application logs effectively without losing time.
If you have not already signed up for Application Insights, then now is the time: Get Started. If you are an Application Insights customer, we are waiting to hear your feedback here as comments or in the user voice forum.

 Light
Light Dark
Dark
0 comments