
Custom TraceSource and debugging using IntelliTrace
IntelliTrace in Visual Studio Enterprise comes with support for tracing out of the box. All you have to do is make sure the appropriate IntelliTrace events are enabled in VS settings and IntelliTrace will capture trace statements as events.
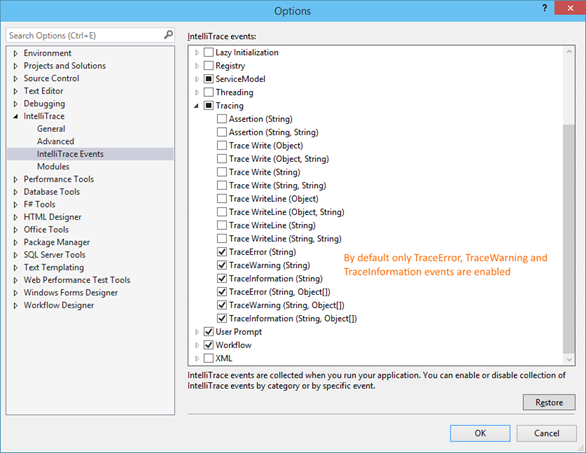
When you are not using the default Debug.Trace methods and are instead using a custom TraceSource, you don’t want to rewrite your tracing code just to get the trace data captured by IntelliTrace. This blog post will explain how to add support for events from a custom TraceSource in addition to the events listed in VS settings (see screenshot above).
If you’d like, you can download the source code and follow along as well as the .itrace file that was generated.
Overview
- Create a custom TraceListener specifically for IntelliTrace
- Enable the custom TraceListener for your application
- Update the collection plan XML file to tell IntelliTrace about the custom TraceListener
- IntelliTrace will now pick up all messages that are sent to the custom TraceListener
Step 1 – Create a custom trace listener specifically for IntelliTrace
Create a class that extends TraceListener (you will need a reference to System.Diagnostics). In this example we are using the namepace “CustomTracing”, we will need to know this later on. You can use a difference namespace for your TraceListener, but make sure you use that same namespace whenever we are using “CustomTracing” throughout this example.
using System;
using System.Diagnostics;

namespace CustomTracing
{
    class TraceListenerForIntelliTrace : TraceListener
    {
        ///<summary>
        /// A class scope variable that holds the contents of the current
        /// trace message being sent to this custom TraceListener.
        /// We can expect multiple .Write(string) calls and one final
        /// .WriteLine(string) call that will signify the end of the message.
        ///</summary>
        private string message = String.Empty;

        public override void WriteLine(string message)
        {
            // Since we are told to WriteLine now, it means
            // this is the last part of the message
            this.message += message;
            this.WriteMessage(this.message);

            // Since we just wrote the last part of the messsage
            // reset the class scope variable to an empty string
            // to prepare for the next message
            this.message = String.Empty;
        }

        public override void Write(string message)
        {
            // Since we are told to just Write and not WriteLine
            // it means there is more to come for this message, so
            // use a class scope variable to build up the message
            this.message += message;
        }

        public void WriteMessage(string message)
        {
            // Do nothing here, we just need the method to exist
            // so that IntelliTrace can hook into it and extract
            // the parameter "message"
        }
    }
}
Step 2 – Enable the custom TraceListener for your application
Make the following changes to app’s config. The highlighted parts will need to be updated with the appropriate namespace and class name that you choose for your custom TraceListener.
<system.diagnostics>
    <sources>
      <source name="TraceTest" switchName="SourceSwitch"
        switchType="System.Diagnostics.SourceSwitch" >
        <listeners>
          <add name="TraceListenerForIntelliTrace" type="CustomTracing.TraceListenerForIntelliTrace, CustomTracing"/>
          <remove name ="Default" />
        </listeners>
      </source>
    </sources>
    <switches>
      <!-- You can set the level at which tracing is to occur -->
      <add name="SourceSwitch" value="Information" />
      <!-- You can turn tracing off -->
      <!--add name="SourceSwitch" value="Off" -->
    </switches>
</system.diagnostics>
Step 3 – Update the collection plan XML file to tell IntelliTrace about the custom TraceListener
Add the following XML fragment just before the closing tag. The highlighted part will need to be updated with the name of the assembly that contains your custom TraceListener.
<ModuleSpecification Id="custom">CustomTracing.exe</ModuleSpecification>
Add the following XML fragment just before the closing tag. The highlighted parts will need to be updated with the appropriate namespace and class name that you choose for your custom TraceListener.
<DiagnosticEventSpecification enabled="true">
        <CategoryId>tracing</CategoryId>
        <SettingsName _locID="settingsName.Custom">Custom TraceSource</SettingsName>
        <SettingsDescription _locID="settingsDescription.Custom">Custom TraceSource</SettingsDescription>
        <Bindings>
          <Binding>
            <ModuleSpecificationId>custom</ModuleSpecificationId>
            <TypeName>CustomTracing.TraceListenerForIntelliTrace</TypeName>
            <MethodName>WriteMessage</MethodName>
            <MethodId>CustomTracing.TraceListenerForIntelliTrace.WriteMessage(System.String):System.Void</MethodId>
            <ShortDescription _locID="shortDescription.Custom">"{0}"</ShortDescription>
            <LongDescription _locID="longDescription.Custom">"{0}"</LongDescription>
            <DataQueries>
              <DataQuery index="1" maxSize="4096" type="String" name="message" _locID="dataquery.Custom.text" _locAttrData="name" query=""></DataQuery>
            </DataQueries>
         </Binding>
        </Bindings>
      </DiagnosticEventSpecification>
Where to make this change when using F5/Attach
If you are using F5/Attach to debug the application, then you need to change the “collectionplan.xml” file found here:
C:Program Files (x86)Microsoft Visual Studio [Version of your VS]Common7IDECommonExtensionsMicrosoftIntelliTrace[Version of your VS]en
For example, for VS 2013:
C:Program Files (x86)Microsoft Visual Studio 12.0Common7IDECommonExtensionsMicrosoftIntelliTrace12.0.0en
Where to make this change when using the IntelliTraceStandalone Collector
If you are using the IntelliTrace Standalone Collector then you need to change the collection plan .xml file that you pass in as an argument using PowerShell. More information on how to use the standalone collector.
Where to make this change when using Microsoft Monitoring Agent (MMA)
If you are using MMA then you need to change the collection plan .xml file that you pass in as an argument using PowerShell and the Start-WebApplicationMonitoring command. If you are not used to providing a custom collection plan, you can find the default collection plans here:
C:Program FilesMicrosoft Monitoring AgentAgentIntelliTraceCollector
Where to make this change when using Azure
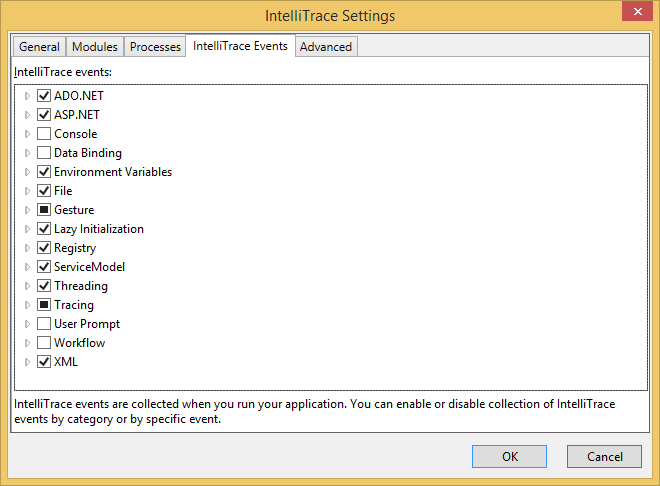
When you publish your project to Azure, you get the choice to enable IntelliTrace and change its settings

Clicking “Settings…” shows this dialog which looks just like the Visual Studio settings for IntelliTrace, but it’s not quite the same:
As a result of enabling IntelliTrace and changing the settings a new collectionplan.xml file will appear here:
%appdata%MicrosoftVisualStudio12.0Cloud Tools
This is the actual XML file that gets uploaded to Azure. So it’s this XML file that you need to add the XML fragment to for the custom TraceListener.
Step 4 – IntelliTrace will now pick up all messages that are sent to the custom TraceListener
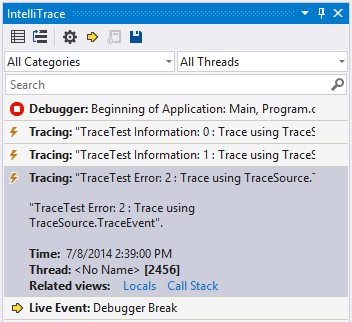
My demo console app below is trying to write 3 different trace messages
using System;
using System.Diagnostics;

namespace CustomTracing
{
    class Program
    {
        static TraceSource ts = new TraceSource("TraceTest");

        static void Main(string[] args)
        {
            ts.TraceInformation("Trace using TraceSource.TraceInformation");
            ts.TraceEvent(TraceEventType.Information, 1, "Trace using TraceSource.TraceEvent");
            ts.TraceEvent(TraceEventType.Error, 2, "Trace using TraceSource.TraceEvent");

            Console.WriteLine("Hit enter to exit...");
            Console.ReadLine();
        }
    }
}
so I expect IntellITrace to pick up 3 separate trace events
Bonus Step 5 – Customizing your trace messages
You have two ways to customize the way your trace messages are captured by IntelliTrace:
- Manipulate the string within your custom TraceListener class before calling method WriteMessage(string message) is called.
- Change the .xml collection plan file, and more specifically the elements ShortDescription (what IntelliTrace shows in VS while the event is collapsed) and LongDescription (what IntelliTrace shows in VS while the event is selected and expanded
<ShortDescription _locID="shortDescription.Custom">"{0}"</ShortDescription>
<LongDescription _locID="longDescription.Custom">"{0}"</LongDescription>
<ShortDescription _locID="shortDescription.Custom">"{0}"</ShortDescription>
<LongDescription _locID="longDescription.Custom">Trace captured by custom TraceListener: "{0}"</LongDescription>
CustomTracing (source code).zip
 Light
Light Dark
Dark
0 comments