
Filter Breakpoints
This blog post is part of a series on breakpoints in the Visual Studio debugger and has been updated to reflect the experience of using Visual Studio 2015. If you are interested in details about setting conditional breakpoints using earlier versions of Visual Studio please see the MSDN documentation. The code used in the examples below is available to download.
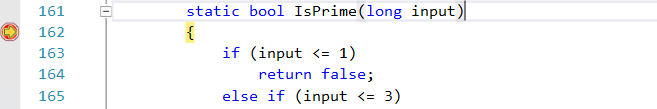
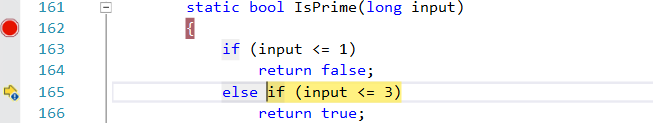
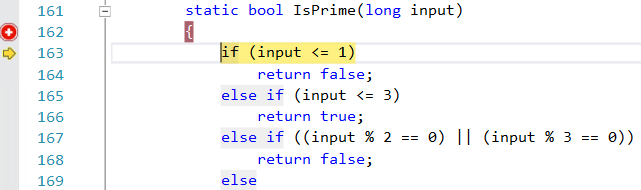
Filter breakpoints can be extremely helpful when your application is running the same method many times in parallel. Consider the example where we are calling FindPrime() 4 times in parallel. You’ll notice that FindPrime() calls IsPrime() several times. To illustrate this problem, let’s see what happens when we set a conventional breakpoint in IsPrime(). At first we hit the breakpoint in this function as expected.
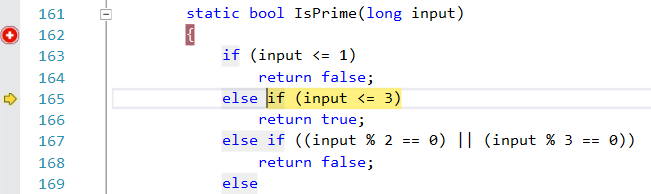
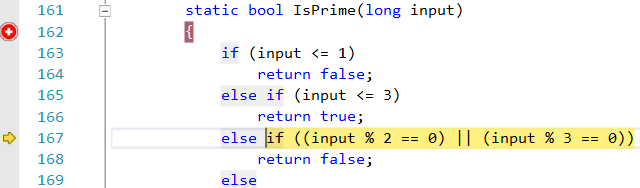
But that as we start to step through the function, we notice some strange behavior.
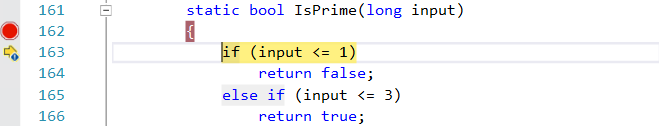

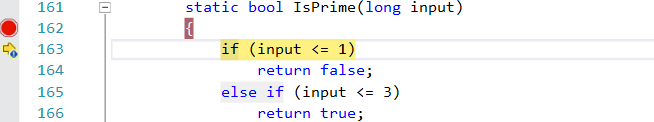
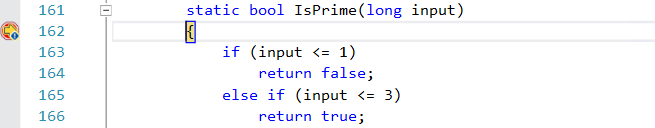
We seem to just be jumping around. This is because different threads are hitting the same breakpoint while you are stepping. Then the debugger is also stopping when each step is completing. The order of these events is not deterministic so it will likely be different the next time you debug.
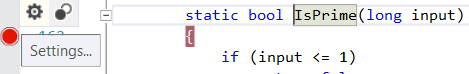
Using a filter breakpoint, you can instead just focus on a single thread. To create the filter breakpoint, hover over the breakpoint to bring up the breakpoint’s toolbar and click the “Settings…” icon.
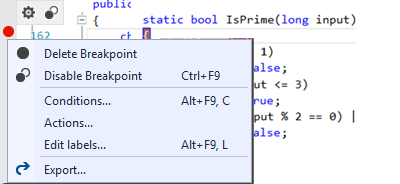
You can also right-click on the breakpoint to bring up the context menu, and select “Conditions…” or use the keyboard shortcut Alt+F9, C
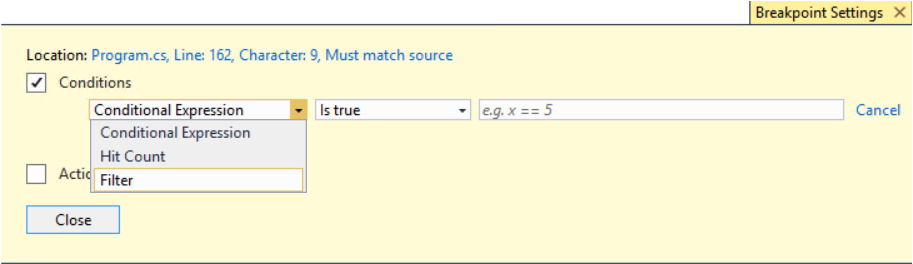
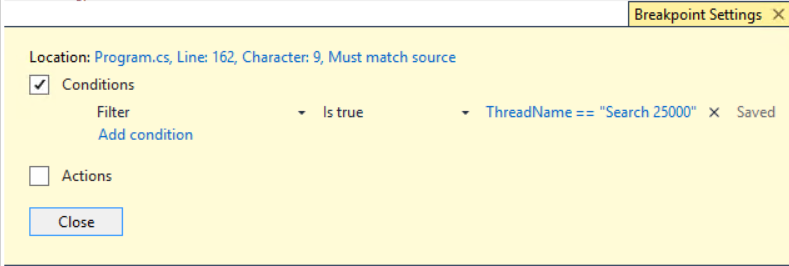
This will bring up the Breakpoint Settings window. Now check the box to add “Conditions” and change the type of condition in the first dropdown from “Conditional Expression” to “Filter”. (Tip: Using the context menu or shortcut key will open the window with the Conditions box already checked.)
You’ll notice that there are 5 different ways to filter the breakpoint: MachineName, ProcessId, ProcessName, ThreadId, and ThreadName.
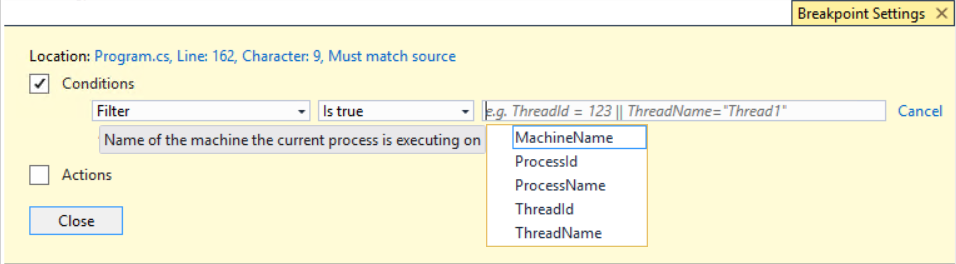
Since we want to focus on a single thread that is running through IsPrime(), we will filter on ThreadId. If you had code running in parallel across different processes or machines, you could use this same technique using those filters as well.
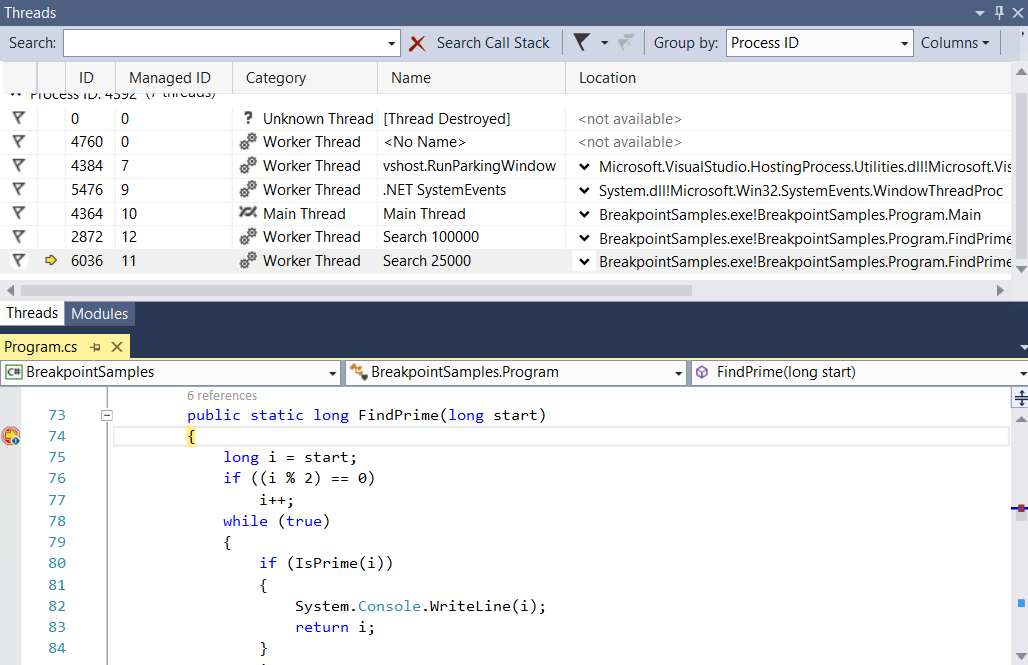
First we must figure out which thread we want to stop on. To do this, we will set a conventional breakpoint on FindPrime(). When we stop at this breakpoint, we can use the Threads window to see the ID of our thread is 6036.
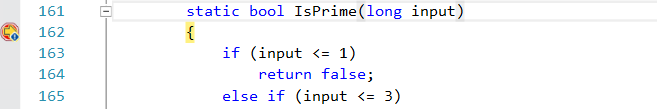
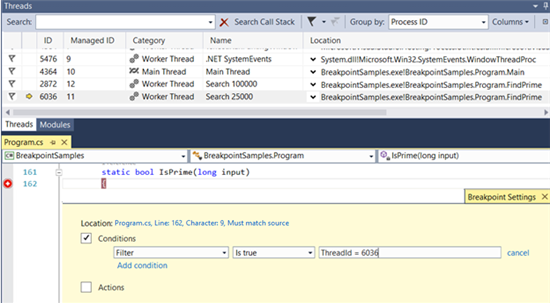
Now we can go back to our breakpoint on IsPrime and setup the filter.
And then we can see that stepping through the function behaves as we would expect.

One disadvantage to this approach is that you need to find the Thread ID each time you run the application. To avoid this, you can instead name your threads.

And then apply the filter to the name instead as this will not change between debug sessions.
The caveat here is that this may not work if you are using tasks or thread pool threads as threads can only be named once.
 Light
Light Dark
Dark
0 comments