
Function Breakpoints
This blog post is part of a series on breakpoints in the Visual Studio debugger and has been updated to reflect the experience in Visual Studio 2015. In this post, we will show the function breakpoints feature of Visual Studio and how this feature can be used to save you time while debugging.
Dealing with Overloads
Let’s say that you want the debugger to stop in a specific function, but this function has a lot of overloads. One option would be to go through the code and set breakpoints on all of the overloads individually. If there are a lot of overloads, this could be quite time consuming. Another option is to use function breakpoints.
In our example (with code available to download), let’s say that you wanted to stop in the function IsPrime(), which has 4 overloads. The first thing that we will do is go to the Breakpoints Windows (can be accessed by clicking Debug->Windows->Breakpoints if it is not already visible) and click “New”.
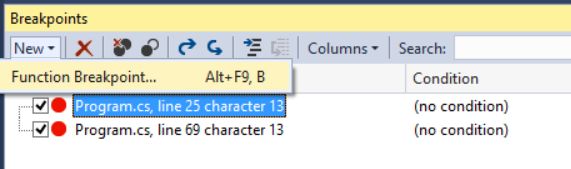
Then click “Function Breakpoint…” to bring up the new breakpoint dialog. You might notice that you can also bring up this dialog by pressing Alt+F9, B.
Note: This shortcut (Alt+F9, B) is different from previous versions of Visual Studio which use Ctrl+B.
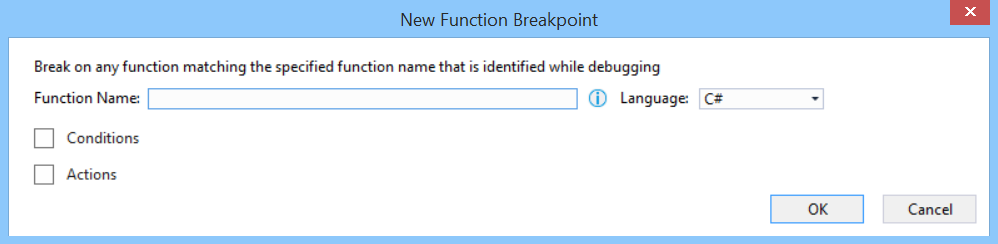
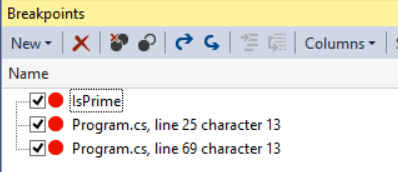
Enter “IsPrime” for the function name and click OK. This will create the Function Breakpoint. We can see it appear in the Breakpoints Window.
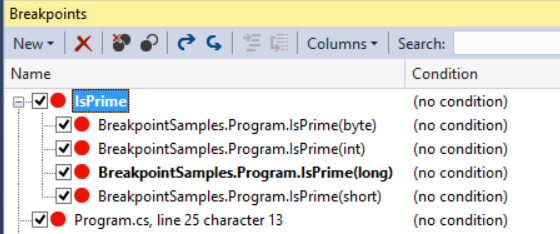
When I execute the program the breakpoint will be hit whenever a method named IsPrime is called. The function overloads will appear as a tree of breakpoints in the Breakpoints Window. You can double click on any of these breakpoints to navigate to the source code.
I can hit the breakpoint in the version of IsPrime that my app is calling.

When Source Isn’t Immediately Available
Another useful trick with function breakpoints is to set breakpoints in code when that code is not readily available. To illustrate this, we will use the C++ example (available for download). This example uses ATL and let’s say we wanted to debug the ATL code to see how it works. While the ATL code is available, you are unlikely to just have it open in your IDE. Even if you did, it would probably take a while to figure out where to set a breakpoint.
You can save some time by using function breakpoints. In this code example, I am using CComPtr with the object CObject1. To set breakpoints on the ATL functions that I will use, I bring up the Breakpoints window as I did before.

If I enter ATL::CComPtrBase

Now when I run the application, I will stop at these breakpoints and Visual Studio will take me to the right place in the source code.

 Light
Light Dark
Dark
0 comments