Code Coverage in Microsoft Test Manager – Deep Dive
With the Quarterly Update1 for Visual Studio 2012, we have enabled collection of code coverage information for manual testing of ASP.Net web applications running under Internet Information Services (IIS). Testers will now be able to get data about how much code is covered as part of their manual testing effort using Microsoft Test Manager (MTM). This blog post by Mike Douglas provides an overview of how code coverage in MTM works. As his post points out, there are several features and improvements that have been introduced with this update. The topics discussed in this post include the important parts of the code coverage configuration, the multi-user testing scenario and the details about the consolidated build level coverage file.
Simplified Configuration
For getting code coverage information, you need to create a StandardLab Environment by installing Test Agent on your web server machine. The overall experience of creating an environment has been simplified greatly in Visual Studio 2012 with auto-agent installation and configuration. The user also does not need to provide any special permission to Test Agent as opposed to Visual Studio 2010 where administrative privileges were required for collecting code coverage information.
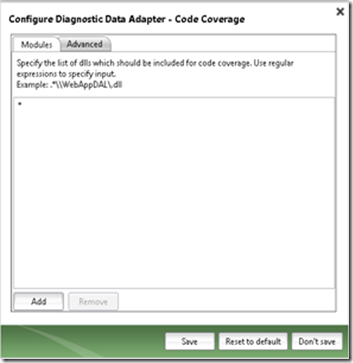
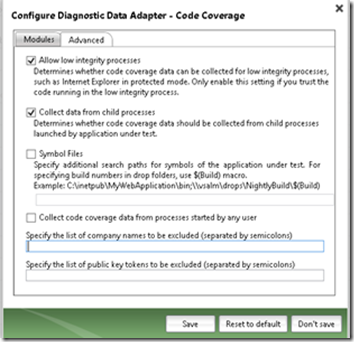
Code coverage in MTM works as a diagnostic data adapter and like any other adapter you need to enable and configure it in your test settings.


By default, the code coverage engine tries to instrument all the loaded assemblies for which it can find matching symbols. You can override this and specify specific assemblies that you want to include for code coverage. Also, if the symbols are not deployed alongside the product assemblies, then you’ll have to specify additional folders to search for matching PDB files. These additional folders can be on a network share but make sure that the latency between the network share and the Test Agent machine is not very high as these PDBs need to be loaded for getting source related information.
Support for Multiple Users
Product teams generally have a shared IIS server which is used by all the testers in the team for executing their test cases. Keeping this in mind, we have also added support for allowing multiple users to test simultaneously against a web server . A typical flow with two users testing against the same environment would look something like below:
- User1 starts a manual test run against environment Env1.
- Test Agent on Env1 starts a code coverage session.
- Test Agent restarts all the IIS worker processes on the web server. This is required for instrumenting w3wp.exe for code coverage.
- User1 continues with his testing and accesses web applications from MTM machine.
- User2 starts a new manual test run against Env1.
- Since there is already a test session in progress on Env1, the test settings from User2 are ignored. IIS worker processes are also not restarted this time.
- User2 continues with his testing.
- User1 finishes his testing.
- User2 finishes his testing.
- Test Agent ends the code coverage session.
Both User1 and User2 will get coverage attachment at the end of their respective runs. One important thing to note here is that even with multiple users there is only one code coverage session on the web server. When a user ends his test run, he gets all the coverage information collected till that point which means in the above flow, User1 will get coverage data for all the code executed by w3wp.exe between step 3 and step 8. Similarly User2 will get coverage data for code executed between step 3 and step 9. There will be some duplication of coverage information in this case which is exactly the problem addressed by build level coverage file introduced with this update.
Build Level Coverage Information
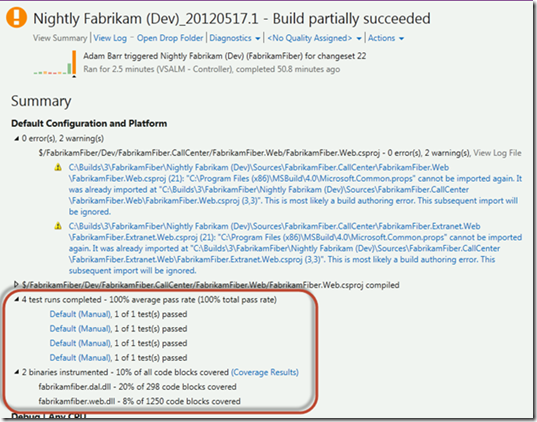
Code coverage is an important metric for deciding the quality of a build and so we have introduced a build level coverage file which contains consolidated code coverage information about all the runs that were published against that build. Whenever the user publishes a test run (manualautomated) with code coverage information against a build, a background job on the TFS merges coverage information from the new run with the already published runs and keeps it on the server in the form of a file. This file can be downloaded from the coverage results link on the build summary page in Visual Studio.

The background job also puts the coverage information into the TFS database which is used by the TFS warehouse for generating code coverage reports.
While the code coverage warehouse functionality was present in Visual Studio 2010 as well, with QU1, we have made an important change in the way coverage information is written to the database. The coverage job no longer writes function level coverage information to the warehouse database. This is mainly for two reasons; one, it takes a lot of time to write information about each function to the database and two, it causes the database size to grow very large over time. With the build level coverage file available this information was more or less redundant and the user could always get function level coverage data from the consolidated file. The below code shows how you can download the build coverage file and get the function level information:
string serverPath = string.Format(CultureInfo.InvariantCulture, “/BuildCoverage/{0}{1}”, build.BuildNumber,
string.Format(CultureInfo.InvariantCulture, “.{0}.{1}.2}.coverage”,
buildCoverage.Configuration.BuildFlavor,buildCoverage.Configuration.BuildPlatform,
buildCoverage.Configuration.Id.ToString(NumberFormatInfo.InvariantInfo)));
string coverageFileUrl = String.Format(CultureInfo.InvariantCulture, “{0}/{1}/_api/_build/ItemContent?buildUri={2}&path={3}”,
build.BuildServer.TeamProjectCollection.Uri.AbsoluteUri, Uri.EscapeDataString(build.TeamProject),
Uri.EscapeDataString(build.Uri.AbsoluteUri), Uri.EscapeDataString(serverPath));
string localFilePath = “c:Build.Coverage”;
WebClient myWebClient = new WebClient();
myWebClient.DownloadFile(coverageFileUrl, localFilePath);
CoverageInfo firstCoverageInfo = CoverageInfo.CreateFromFile(localFilePath);
The CoverageInfo class contains all information required for getting module and function level data.
Lastly, the CoverageInfo class now also has a public API which can be used for merging data from two coverage files into a consolidated output coverage file.
Caveats
We have tried to make the whole experience of collecting code coverage as seamless as possible but still there are a few things to be kept in mind when using code coverage in MTM:
1. Code coverage itself does not require Test Agent to be run with administrative privileges but if the test settings contains other profiler based collectors like Intellitrace and Test Impact, then you need to configure Test Agent to run under an administrator account.
2. In case of multiple users testing against the same environment, the settings for the second user are ignored totally. So even if the second user has not selected code coverage in his settings, he’ll still get coverage data as part of his test run results.
3. Make sure you do not have TFS and the Test Agent installed on the same machine as the agent restarts all the IIS worker processes at the start of the test run. TFS also has an IIS component and restarting all the worker processes will cause the server to go offline.
This blog has been authored by Nitya Kumar Sharma & Hardik Patel, developers on the Visual Studio ALM team.

 Light
Light Dark
Dark
0 comments