A Simply but Great Visual Network Tool to Improve Web Site Performance and Best Practices
A few days ago, I needed to analyze and profile a start page of a web site. My main concern was performance (time to get all the page, network issues, unnecessary round trips, unnecessary bytes, ...).
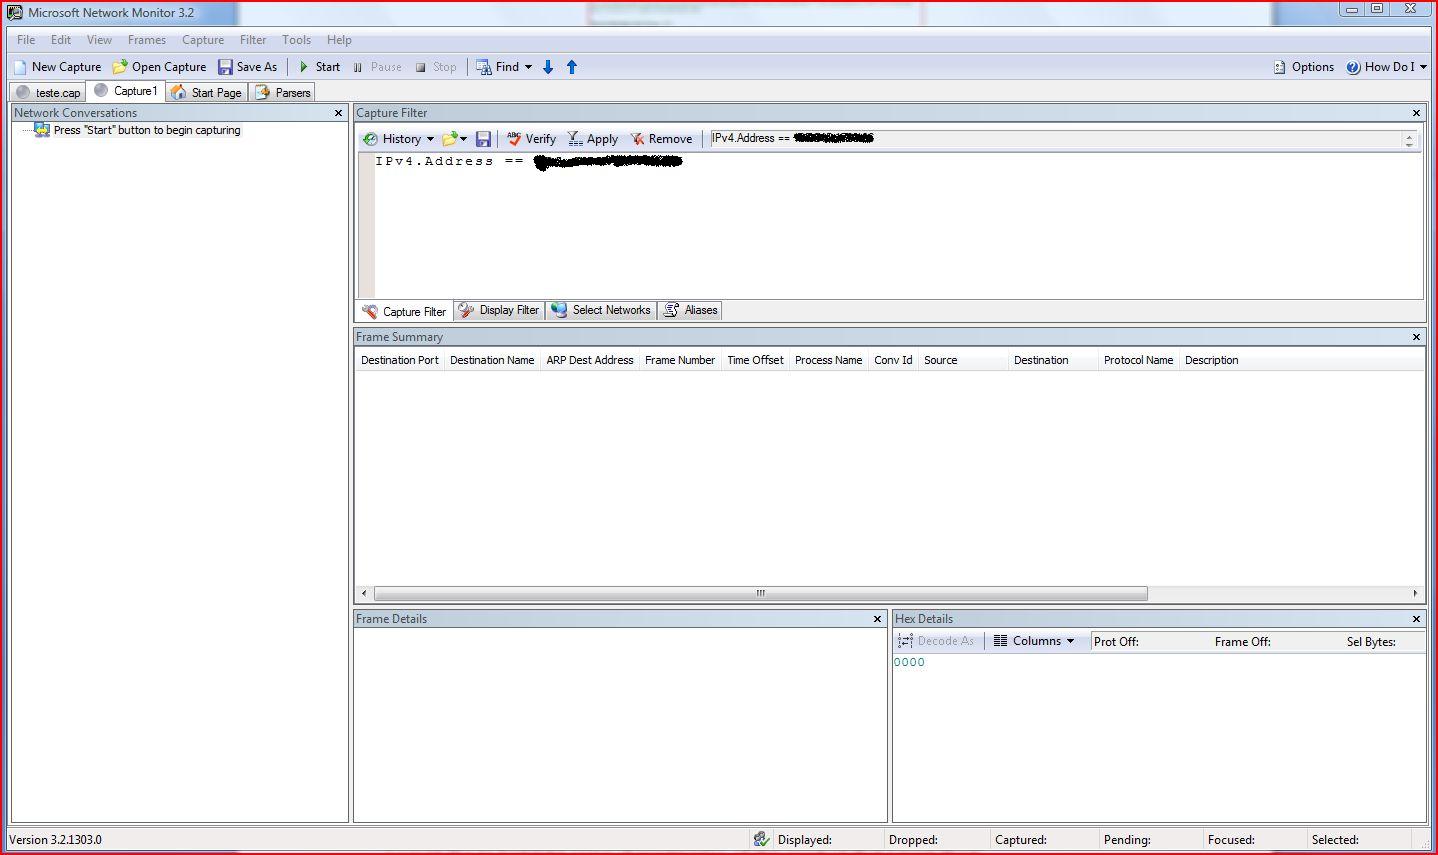
My first question: Which tool can help me? I found a lot of network tools, and I started out with Microsoft Network Monitor 3.2, which is a fantastic and powerful tool, but after I opened the capture file, I got a window with the following information:
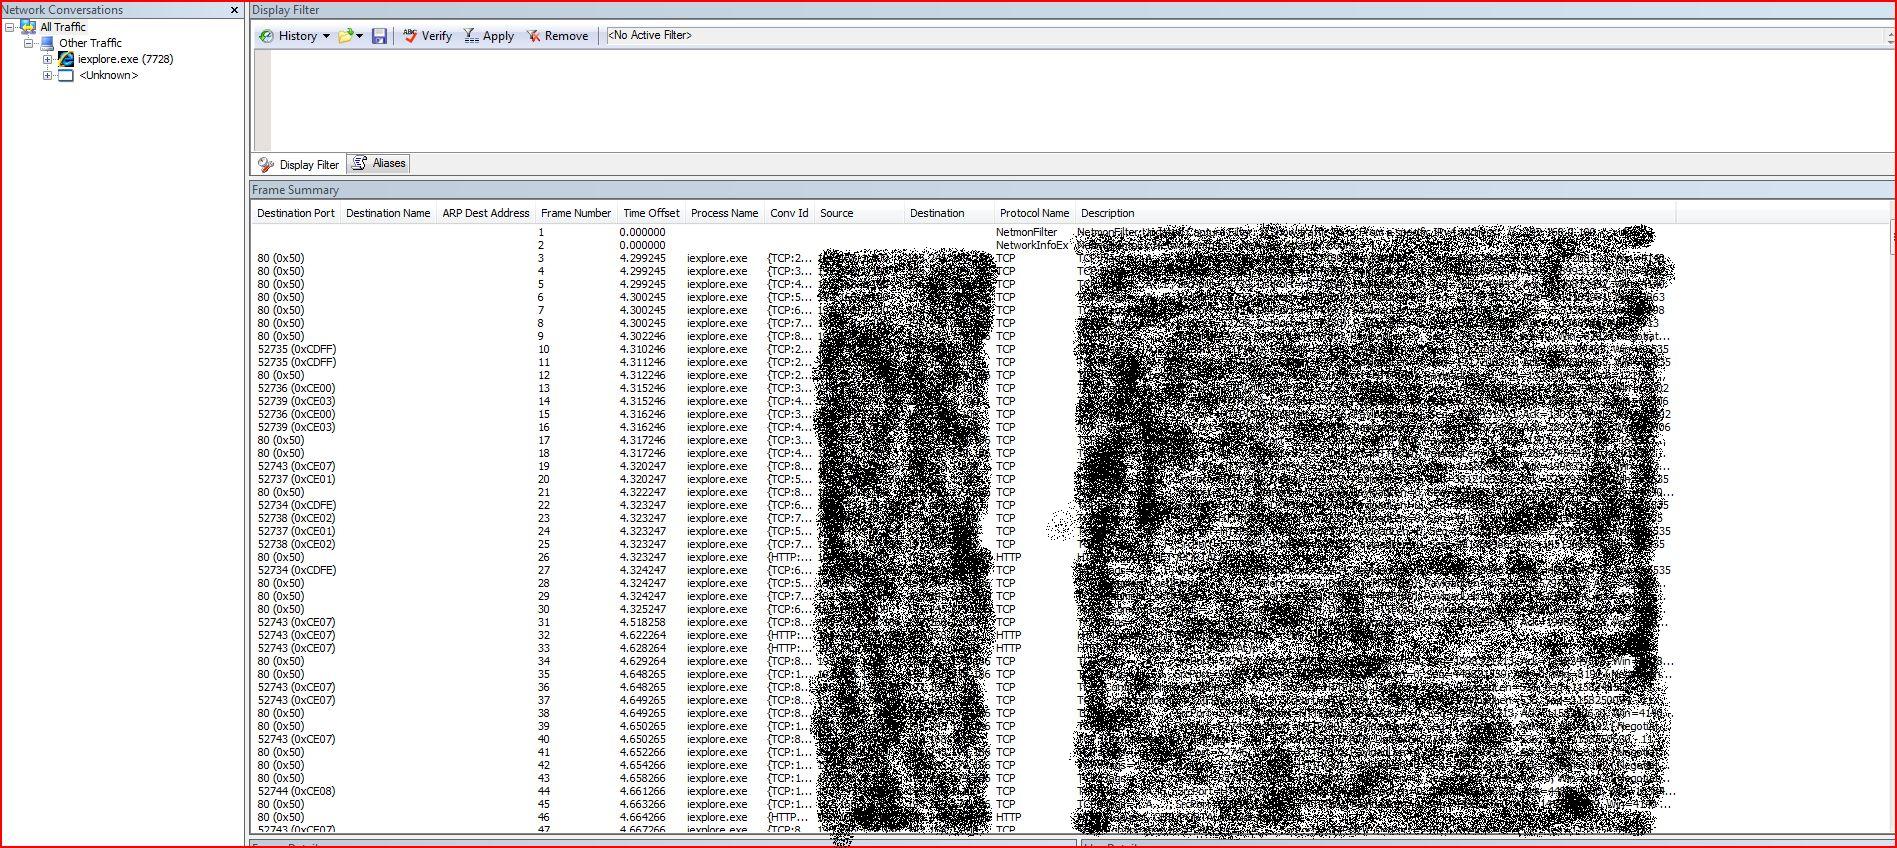
If you don't have some experience with this tool (or any other similar), you will need some time to understand the results. Also you will need to have some knowledge on Network specifics to identify areas to improve on your web site.
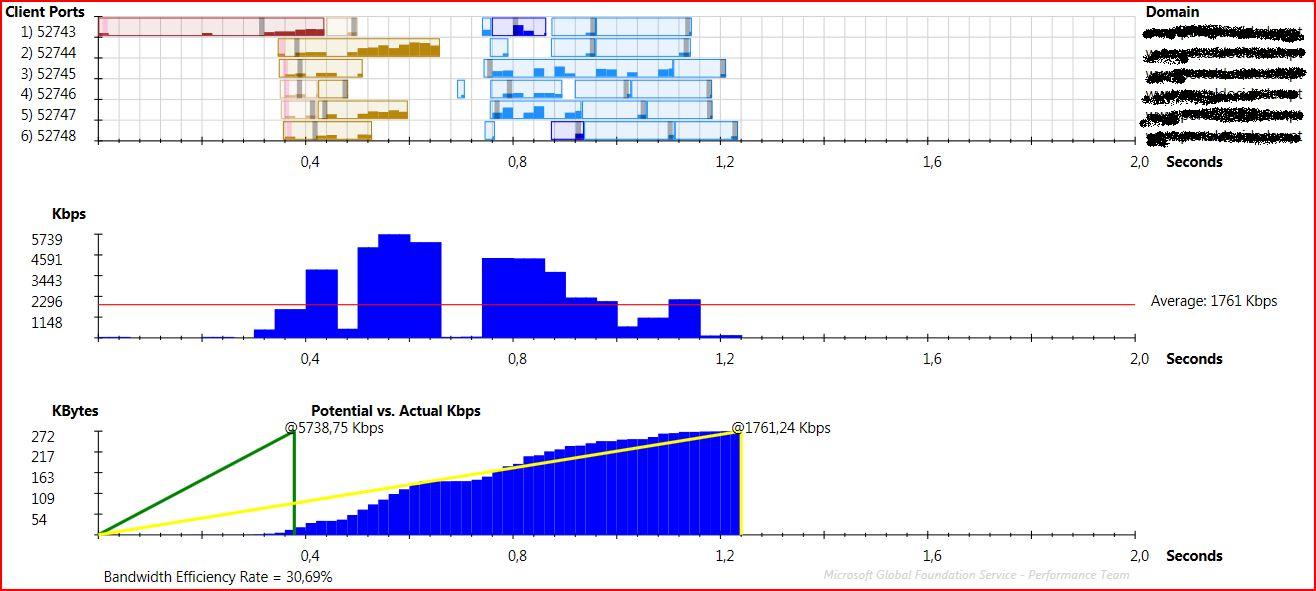
I decided to try a different approach, so, after some research, I found this tool: Visual Round Trip Analyzer, which, as the name indicates, is a more visual tool. For the same trace file, I got the following data:
1. A main chart where you can analyze the downloaded files and network characteristics (time, ports, download speed, ...):
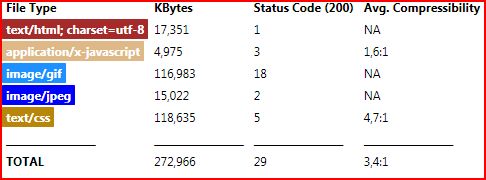
2. Statistics for the types of files downloaded (size, Status Code and Average Compressibility):
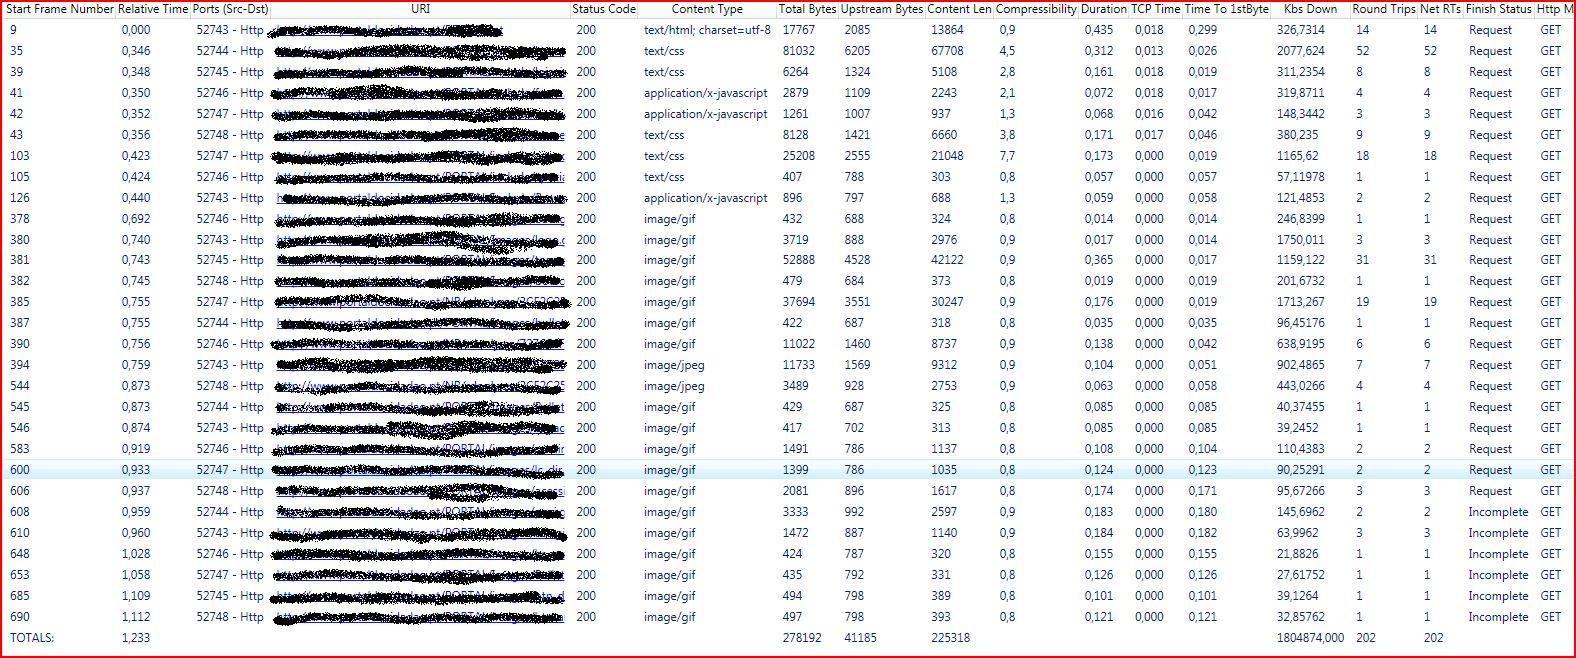
3. Detailed information about all files (Status, Content Type, size, Duration, Time to 1st Byte, Round Trips, ...):
4. And a final Analysis for the trace captured, based on Best-Practices (for each rule, you will have a classification, and some detailed information about the rule):

You will need to have the Microsoft Network Monitor 3.2 installed to obtain the capture (first install NetMon, and only then the VRTA), and then you need to perform the following steps (is my example):
1. Open Microsoft Network Monitor 3.2, and Select "New Capture".
2. Add a Capture Filter like the following : "IPv4.Address == xxx.xxx.xxx.xxx" (the IP of the Web Site that you want to analyze):
3. Select Start, and browse to the Web Site (first page or any other pages that you want to analyze; I suggest that you work on only one page at a time).
4. Stop the capture, and save the file.
5. Open VRTA, and select "Open Cap File":
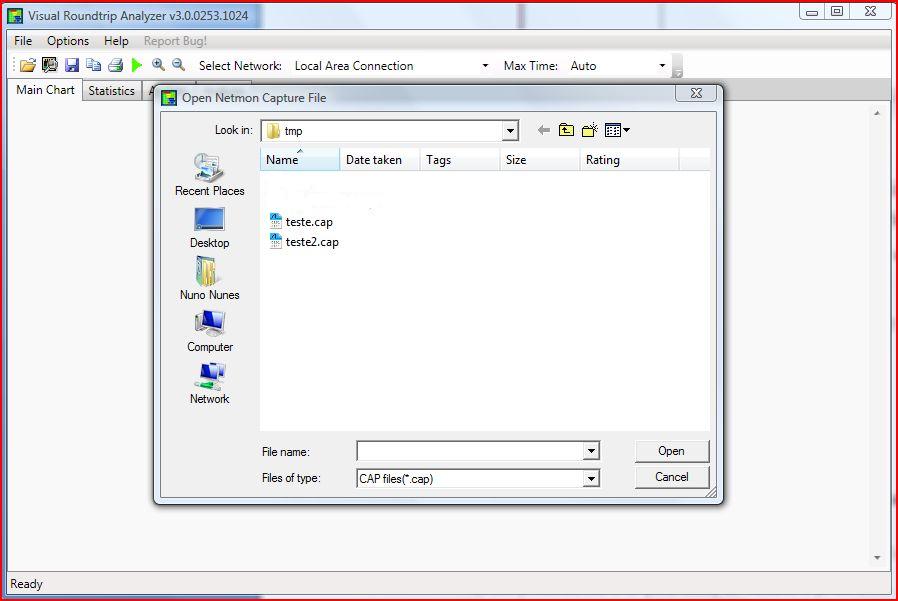
6. Analyze the results (you only need to look for the results).
7. Repeat this steps a few times, for the captures from different time schedules, to confirm the results!
I would like to highlight some of the characteristics of this product that I liked the most:
- Three dimension Chart of downloaded files (files, Port and Time) - You can identify and avoid precedence's in your files, or network problems.
- Download Speed Chart.
- Detailed information for all downloaded files.
- And finally an original and fantastic Best Practice Analyzer - based on the trace and a list of best practices, from which you will get a score for the 15 different rules.
In my particular case, the Analyzer has detected the following ways to improve the response time of Web Site:
- Optimize the Compression in IIS (wasn't turned On - https://www.microsoft.com/technet/prodtechnol/WindowsServer2003/Library/IIS/d52ff289-94d3-4085-bc4e-24eb4f312e0e.mspx?mfr=true )
- Expiration Date Rule - Since no expiration date is found, you will need an additional Round Trip to ask the server if the file is still valid (https://www.w3.org/Protocols/rfc2616/rfc2616-sec14.html ).
- Many small images (Image Cluster Rule), which demands separate connections. The solution was to group near images.
- White Space Rule - We removed the white spaces (unnecessary) from the html and JavaScript to production environment.
All this with a simply Start/Stop in NetMon :).
Remember to get some traces before you get your finally conclusions.
See you next time ...