Debugging in the Dynamics GP 2015 Service Based Architecture

As we move into the world of Service Based Architecture with Dynamics GP 2015, we wanted to highlight some debugging tools that will aid you as you create service procedures of your own. Today you have various things available to you to debug integrations as they are created. Among them are internal tools like the Dexterity script logs and the debugger or methods as simple as dropping the .set file on the runtime executable to ensure Dynamics still launches without error. There are numerous external tools at your fingertips as well such as SQL Profiler, Task Manager and Event Viewer. While you will continue to find great value in these going forward when debugging things “inside” of the Dynamics GP environment we wanted to add tools for gathering information for all of the service events happening “outside” this environment and coming into the Dexterity Process.
While considering the options we knew we wanted to create debugging that was low impact on the process overall and incredibly performant. We wanted to not only provide you errors that were encountered within the service but also provide context to enable easier and quicker debugging. Along with this we wanted to provide a sufficient level of logging by default to strike a balance between usefulness and performance.
To enable this we decided to utilize Event Tracing for Windows (ETW). This is a general-purpose, high-speed tracing facility provided by the operating system and is the standard way to trace used by all features in Windows. This gives developers the ability to instrument an application to provide tracing events, dynamically start and stop tracing sessions and consume trace events if desired. One big advantage to this is you can use any tool available today (and there are many) that consumes these types of logs to serve the trace data up in a way that makes sense for your desired usage. Along with the plethora of tools already available today there are also various listeners such as Logman and Performance Monitor that can be utilized. Other tools to research in this arena would be PerfView and the Semantic Logging Service. The former is very much a power user tool that lets you view machine-wide events correlated with everything else imaginable (CPU samples, CLR events, etc). This is a free tool and is particularly handy if you are doing .NET performance assessments. The Semantic Logging Service can be set up to listen to a specific set of EventSources (ours all have unique names) and pick a central log sink (a file, a console session, etc) so it is highly customizable to provide the exact data you want in the format that makes sense.
If you are researching ETW consuming applications the Event Source names of our services are:
Microsoft-Dynamics-GP-Svc-GPService
Microsoft-Dynamics-GP-Svc-DexterityService
Microsoft-Dynamics-GP-Svc-DexterityProcess
Now onto the new functionality we added. The first debugging tool I’d like to highlight is trace messages. These messages can be placed within your sanScript procedures and then captured so you can verify how far within an event you are going and the data that is set at those points. These trace message are then captured in the various logs we’ve created to monitor requests as they move through the service framework from initial request to the Dexterity process. The exact syntax of this is in review so it may be changed by the RTM of GP 2015 but an example of trace messaging in today’s format is:
TRACEMSG("Set Buyer ID: "+'Buyer ID' of window Buyer_Lookup_Scroll + "="+str(i));
The second debugging tool to highlight is the logging that has been added. In the configurable %ProgramData% location we’ve added three main logs that will serve as the cornerstone of the customer/partner debugging experience. The below graphic shows how the requests flow through the service layers and the corresponding events happening that may produce information in each log.
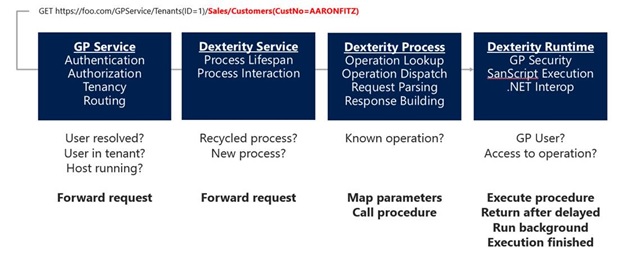
GP Service Log – This is the first place to search if you are looking for the source of a problem but have little information to go on. This is the first layer of the service that a request will hit when sent. As such it will provide information around unknown tenants, authentication failures and if a request did not successfully make it through the GP Service layer for some other reason.
Dexterity Service Log – The next layer a request will flow through is the Dexterity Service Layer. This log file will contain information to help resolve configuration errors with the environment or if there are structural errors in the request being made. One thing to note is if there is an error object or payload contained in this log, you know the request made it through to Dexterity for processing.
These two logs are great for generic errors. However, once the environment is setup and running these logs cease to be as useful for debugging. At this point, the next step would be to ping the service. If that is successful you’ve verified that the hosts, service and pipelines running through to the Dexterity process are working for end to end connectivity. If you still have errors once ping is successful that is when you move to the last main log we’ve added…or potentially further into the usual application logs you are used to using.
Request Log – This log gives you any and all information including errors and context for one single request. A great advantage of this log is that it correlates all of the information together per request so you can follow the link between the service framework events to the Dex events to the response delivered. If you’ve previously added Trace Messages in your sanScript procedures they will appear in this log as well.
Through all of these logs we’ve incorporated a Correlation ID (GUID) that flows through each of the logs to link events together. This ID is returned as part of the response body (Status section) and/or in the response header. It’s important to grab this from a response to easily locate the right request log OR find the relevant lines in a service’s log file. Within each log area you may see an error log and an info log file. The error log is provided to give you a pointer on where to look. This view is great to help isolate and locate the error spots without going through the larger info log. Once you have the pointer you can then delve into the info logs to obtain more specifics as needed.
At this point in your debugging from a log perspective you should have all of the information you need to troubleshoot your requests. If there is an issue that is buried deeper in the architecture we have also created a verbose log. These are the logs that will likely be requested for you to send in if you are reporting a potential issue to Support. There will also be a folder for Dexterity Service Control logs. These won't pertain to you as you are debugging issues you’ll come across because it details information for a piece of the service we use as part of the internal architecture and not one you’d interact with directly.
To round out this debugging post I’d like to briefly talk about some service management API hooks we’ve created on the GP Service Endpoint. As you are working on the environment configuration you may find it helpful to know what tenants or hosts are available and retrieve more in-depth data on these. To do so you can utilize the following:
Management/RouterTable – provides a list of “known” tenants/instances
Management/Hosts – provides a list of host ID’s available
Management/Hosts/{HostID} – provides more information on a specific host such as the full machine name, if it is active, memory utilization percentage, etc
That is a brief overview of the new debugging tools around the service based architecture that will be available with the release of Dynamics GP 2015. As you move into creating your own service procedures remember that your previous methods for gathering debugging information will still be very valuable for you. Now with the additional pieces such as trace messages and the expanded logs available you can broaden that scope of information gathering to include events not only within Dexterity but happening outside of it as well.
Happy Debugging!
Alice