Controlling Support Debugging Tool Automatic Debugger Mode

This is the third in a series of articles that are designed to help you understand how the Support Debugging Tool works and how you can leverage its different features. In the past, I have described features without explaining how these features can be used and what the differences between different modes is. With this series I hope to remedy that situation.
In the previous articles, we discussed the different Logging Modes of the Support Debugging Tool and how to control Manual Logging Mode. In this article we will discuss the various methods of controlling Automatic Debugger Mode. If you missed the other articles, please have a read: Understanding Support Debugging Tool Logging Modes and Controlling Support Debugging Tool Manual Logging Mode.
Automatic Debugger Mode
Automatic Debugger Mode allows us to capture up to 5 different log types from when the logging is started until a specific event and error condition occurs, providing us the exact details of what happened in the code just prior to the error.
Before we can actually look at how to start Automatic Debugger Mode, we need a quick summary of how to set it up. Automatic Debugger Mode uses one or more Trigger IDs created. These triggers can be created by a third party, such as Microsoft Support or a Partner Consultant and can be imported using the Configuration Export/Import facility or can be created on the system using the Setup Automatic Debugger Mode option from the main Support Debugging Tool window (available from the application level or window level Tools menus, or by pressing Ctrl-D).
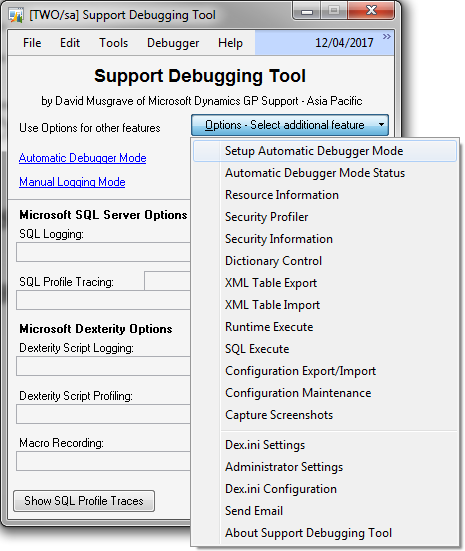
Options menu on Support Debugging Tool main window
A trigger is composed of 5 parts:
- A header with the ID and Description and trigger type and event.
- A description of the resource against which the trigger is applied.
- A selection of actions to perform when the trigger event occurs.
- A script which can check for specific conditions and return the result.
- A selection of options to specify date restrictions and which logging types to use.
The process of creating a trigger for use with the Support Debugging Tool requires that each of the 5 parts is configured.
Below is a simple example which will watch the RM_Customer_MSTR (RM00101) table and every time the table is saved, it will check if the 'Hold' field has been selected.
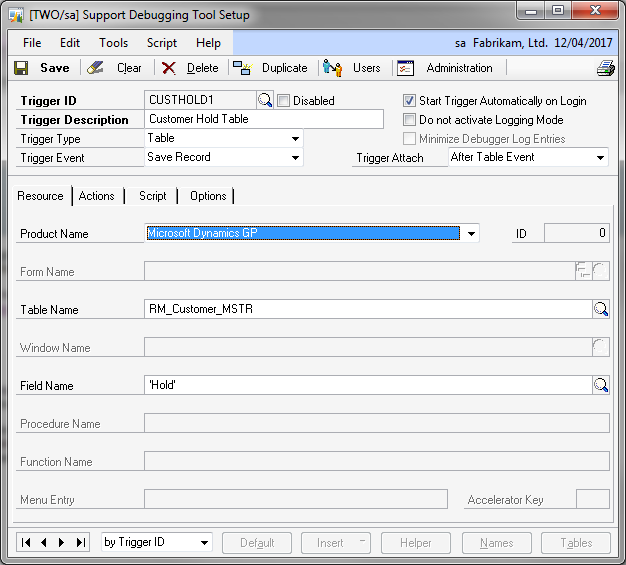
Setup Automatic Debugger Mode window - Resource Tab
If the 'Hold' field has been selected, the Support Debugging Tool will perform the following actions:
- Save the captured logs.
- Display a desktop alert message.
- Send an email to the administrator.
- Export the table record as xml.
- Capture and email Screenshots of all open windows and include a system status report, the Dex.ini and Dynamics.set files.
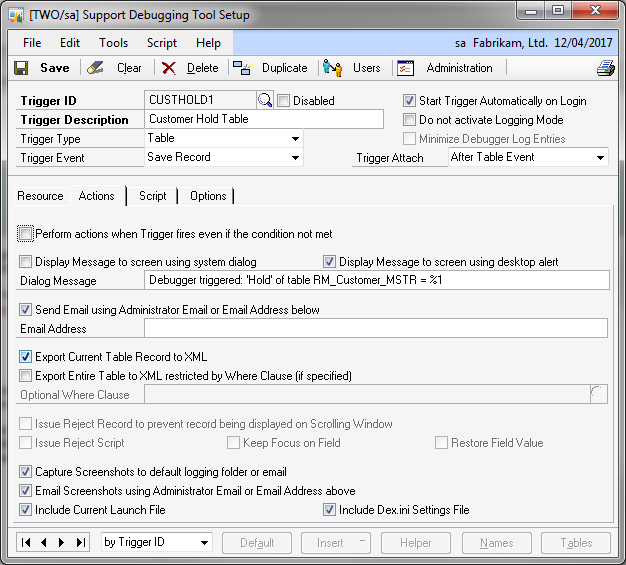
Setup Automatic Debugger Mode window - Actions Tab
The script just checks that either a new record has been saved with the 'Hold' field selected, or an existing record has been changed to have the 'Hold' field selected.
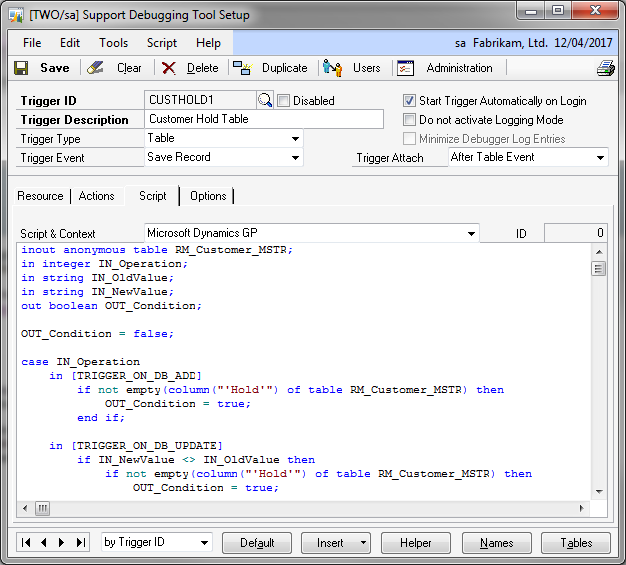
Setup Automatic Debugger Mode window - ScriptTab
Finally, the options specify that all logging types should be used and to use the Small SQL Profile Trace mode.
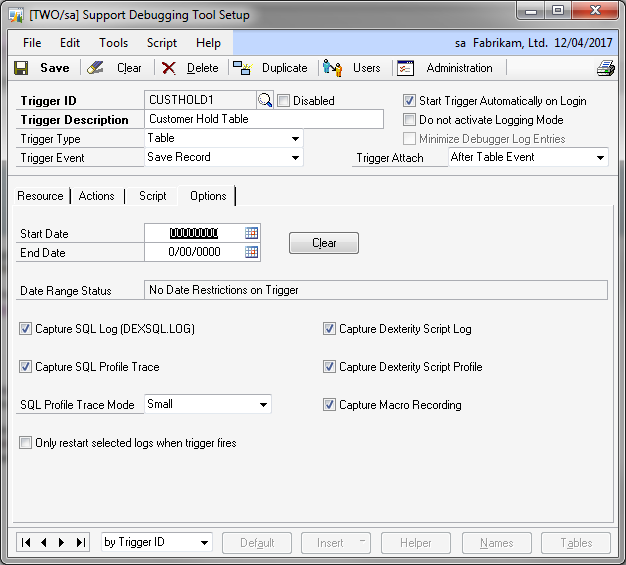
Setup Automatic Debugger Mode window - Options Tab
Now that we have a trigger created and have closed the Support Debugging Tool Setup window, we can look at the different ways to control Automatic Debugger Mode.
Automatic Start at login
Once a trigger has been created and the Start Trigger Automatically on Login option has been selected, it will automatically start next time a user logs into a Microsoft Dynamics GP company.
Notes:
- You can specify the users and/or companies for the trigger to start for by clicking the Users Button. This will allow control of what users and/or companies will have logging activated.
- Automatic Debugger Mode will continue running until the user exits Microsoft Dynamics GP or until the user and/or company is changed.
- Debugger Setup Mode (in the Dex.ini Settings window), must not be enabled as this will stop triggers from starting automatically.
- Each time the event occurs, the trigger will use the script to check if the conditions are met and will perform actions if required before restarting the logging.
Manual Start and Stop
Automatic Debugger Mode can be turned on and off from the main Support Debugging Tool window using the Turn On Automatic Debugger Mode button. You can select to start just the Trigger ID: DEFAULT, or all triggers marked as Automatic Start, or all triggers except those marked as Disabled.
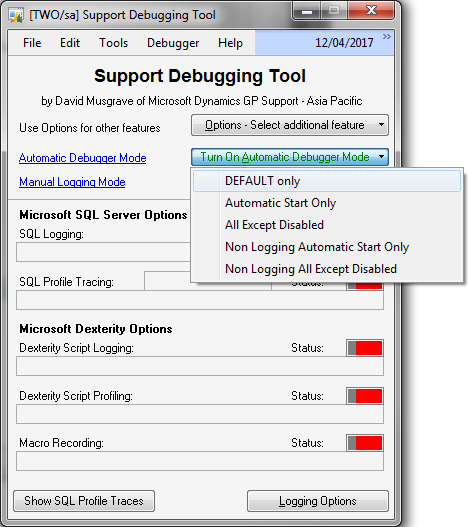
Support Debugging Tool main window
Automatic Debugger Mode can stopped by clicking the Turn Off Automatic Debugger Mode button, by using the Stop Logging option on the application level or window level Tools menus, or by the Ctrl-Shift-F10 keyboard shortcut.
Automated Start and Stop
In a situation where you know approximately where the error condition you are looking for occurs, you can limit Automatic Debugger Mode to start and stop automatically either side of that event. In a similar fashion to automatically starting and stopping Manual Logging Mode, you can use two Non-Logging Automatic Debugger Mode triggers to automatically stat and stop an Automatic Debugger Mode trigger.
For example: If you know that the 'Hold' field is changing while the Customer Maintenance window is open, you can restrict Automatic Debugger Mode to run only while the window is open.
The first step is to stop the existing trigger starting automatically, by unchecking the Start Trigger Automatically on Login check box.
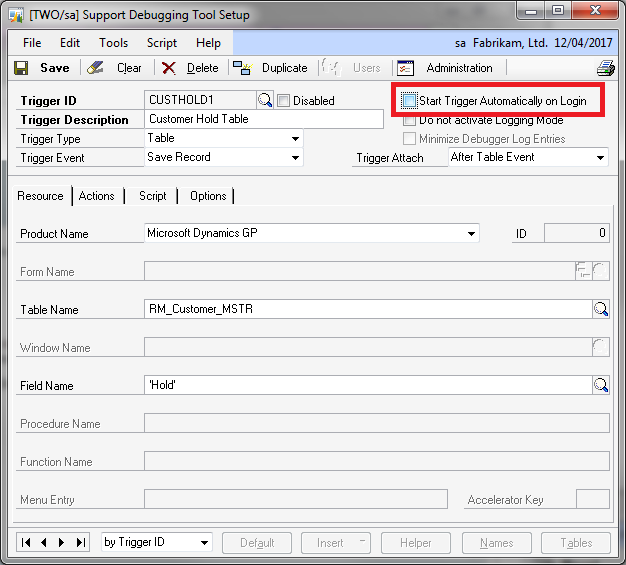
Updated original trigger
Then you just need to create a trigger for the start event and use the conditional script to call the MBS_Trigger_Start helper function.
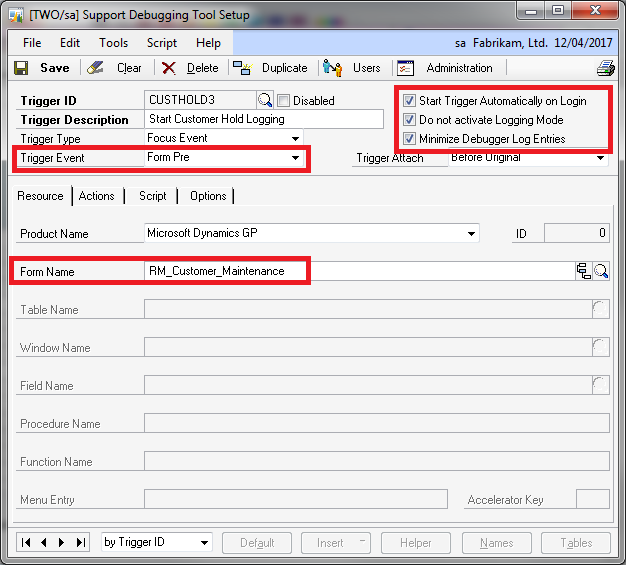
Start trigger Resource settings
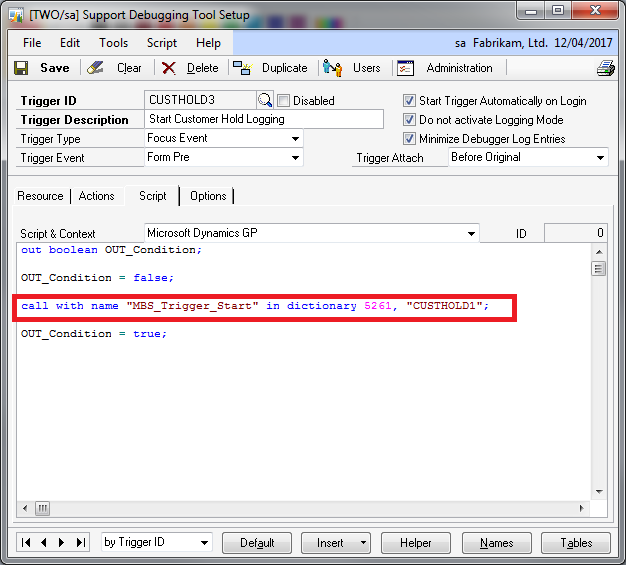
Start trigger script using helper function
Then create another trigger for the end event and user the conditional script to call the MBS_Trigger_Stop helper function.
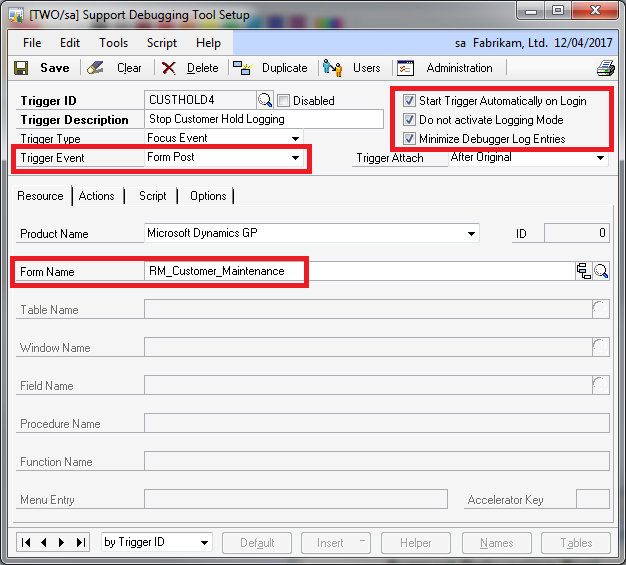
Stop trigger Resource settings
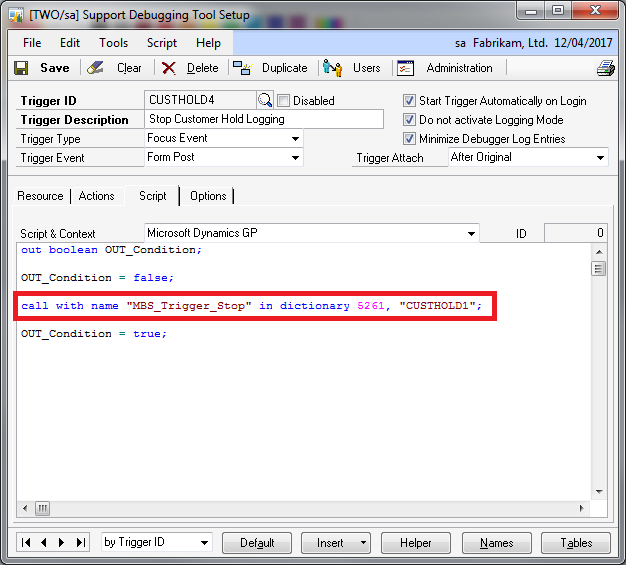 Stop trigger script using helper function
The Debugger Settings XML file for the RM_Customer_Maintenance automated start and stop example are attached as an archive at the bottom of this article.
Notes:
- The Non-Logging triggers will start after login and wait for the defined events to occur, when the events occur the trigger scripts will execute the helper functions.
- No options on the Actions tab need to be enabled on the triggers as we just want the script to run and control Automatic Debugger Mode using the helper functions.
- You can specify the users and/or companies for the trigger to start for by clicking the Users Button. This will allow control of what users and/or companies will have logging activated.
- Debugger Setup Mode (in the Dex.ini Settings window), must not be enabled as this will stop triggers from starting automatically.
- The Non-Logging Triggers can be started manually using the Turn On Automatic Debugger Mode Button >> Non Logging Automatic Start Only or Non Logging All Except Disabled options.
- To confirm the triggers have started, use the Automatic Debugging Mode Status window (open it using the Automatic Debugger Mode hyperlink or the Options >> Automatic Debugger Mode Status from the Support Debugging Tool main window).
- To disable the Non-Logging triggers, use the Unregister Button at the bottom of the Automatic Debugging Mode Status window.
- All triggers must be disabled before you can get back to the Setup Automatic Debugger Mode window.
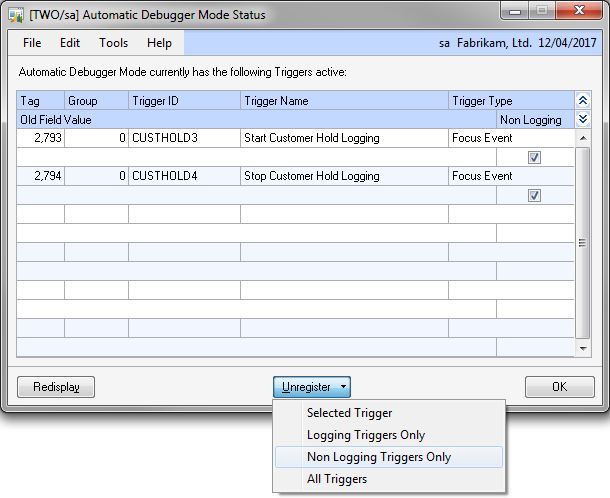
Automatic Debugger Mode Status window
Again you can see the Support Debugging Tool provides great flexibility in how you use Automatic Debugger Mode.
David