Controlling Support Debugging Tool Manual Logging Mode

This is the second in a series of articles that are designed to help you understand how the Support Debugging Tool works and how you can leverage its different features. In the past, I have described features without explaining how these features can be used and what the differences between different modes is. With this series I hope to remedy that situation.
In the previous article, we discussed the different Logging Modes of the Support Debugging Tool. In this article we will discuss the various methods of controlling Manual Logging Mode. If you missed the first article, please have a read: Understanding Support Debugging Tool Logging Modes.
Manual Logging Mode
Manual Logging Mode allows us to capture up to 5 different log types from when the logging is started until it is stopped. In the sections below we will discuss five different ways to control Manual Logging Mode:
Manual Start and Stop
Manual Logging Mode can be manually started by the user interface. As mentioned in the previous article it can be started in the following ways:
- From the main Support Debugging Tool window (available from the application level or window level Tools menus, or by pressing Ctrl-D) using the Turn On and Turn Off buttons.
- Directly from the application level or windows level Tools menus.
- Using the keyboard shortcuts on the Tools menus: Ctrl-Shift-F9 to start and Ctrl-Shift-F10 to stop.
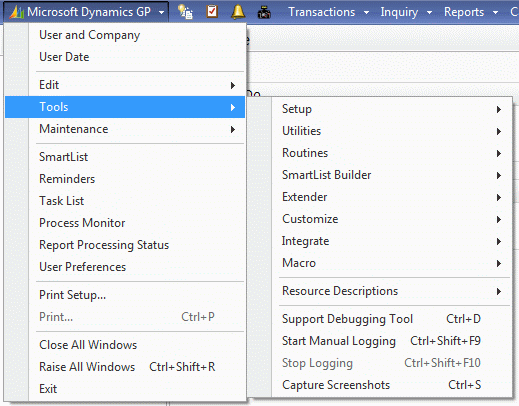 Application Level Tools Menu
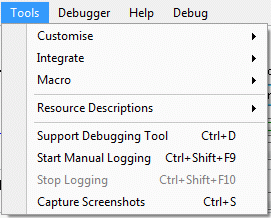 Window Level Tools Menu
As the controls are available from every window's Tools menu, you don't have to go back to the main Support Debugging Tool window or the Application level menus.
Automatic Start at launch
If you need to capture the events after launching Microsoft Dynamics GP, but before you have logged in, you will not be able to do this using one of the Manual Start methods above because you cannot access the main Support Debugging Tool window or Tools menus until after login.
To provide this functionality, the Support Debugging Tool has a Dex.ini setting which can be enabled via the Dex.ini Setting window (available from the Options button menu or the Debugger menu on the main Support Debugging Tool window) or by manually editing the Dex.ini file to add the setting MBS_Debug_LogOnStartup=TRUE.
Notes:
- This option only works once and is then disabled (Dex.ini setting removed) after login has completed.
- Manual Logging Mode is stopped automatically once login has completed.
- SQL Profile Tracing will not be enabled by this method as it cannot be activated until after the user has logged in.
- This option only works for the current workstation using the same Dex.ini file.
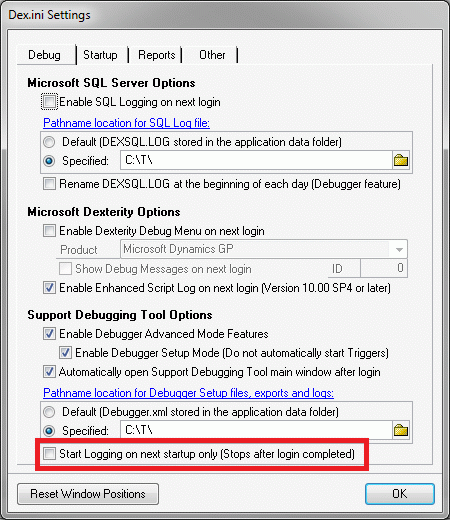
Dex.ini Settings window
Note: If you wish to have this method enabled continuously, you can use the Dex.ini Configuration window to add the MBS_Debug_LogOnStartup=TRUE Dex.ini setting back after each login.
Automatic Start at login
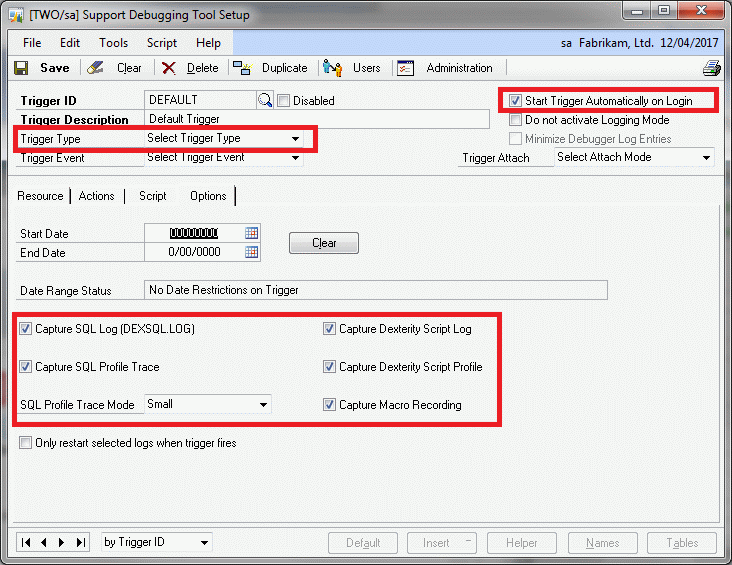
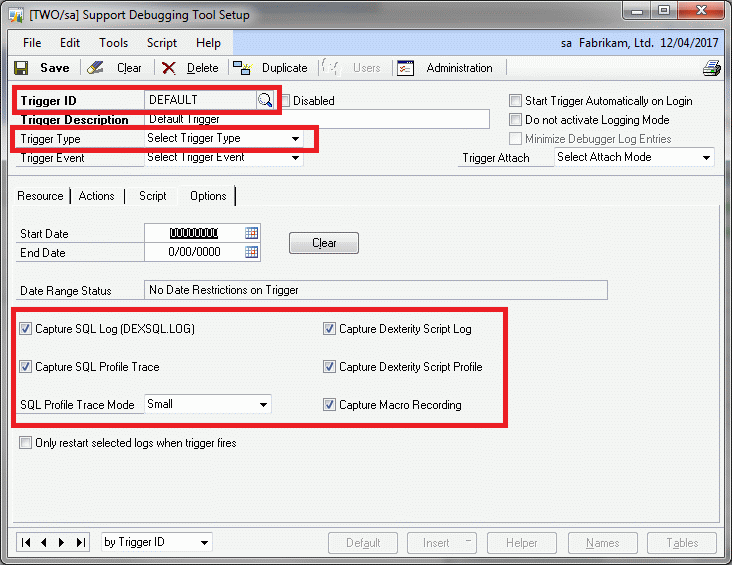
If you would like Manual Logging Mode to start automatically after logging into Microsoft Dynamics GP, you can achieve this by using an Automatic Debugger Mode trigger. Select Options >> Setup Automatic Debugger Mode from the Support Debugging Tool main window.
The trigger must be defined with no Trigger Type selected, marked to Start Trigger Automatically on Login and have the Logging Types you want selected on the Options Tab.
Setup Automatic Debugger Mode window
Notes:
- You can use any Trigger ID for this trigger, but the automatically created DEFAULT trigger is perfect for this task.
- The trigger must be the only logging trigger which starts automatically. If other triggers with Trigger Types selected are started, Automatic Debugger Mode will start instead of Manual Logging Mode.
- You can specify the users and/or companies for the trigger to start for by clicking the Users Button. This will allow control of what users and/or companies will have logging activated.
- Manual Logging Mode will continue running until the user exits Microsoft Dynamics GP or until the user and/or company is changed.
- Debugger Setup Mode (in the Dex.ini Settings window), must not be enabled as this will stop triggers from starting automatically.
Automated Start and Stop
If you would like to turn on Manual Logging Mode automatically for specific events in the application you can use two Non-Logging Automatic Debugger Mode triggers to automatically start and stop Manual Logging Mode.
For example: You want Manual Logging Mode running only while a particular form or window is open, when a particular field change script is running or when a particular procedure or function is being executed.
To achieve this you just need to create a trigger for the start event and use the conditional script to call the MBS_Logging_Start helper function.
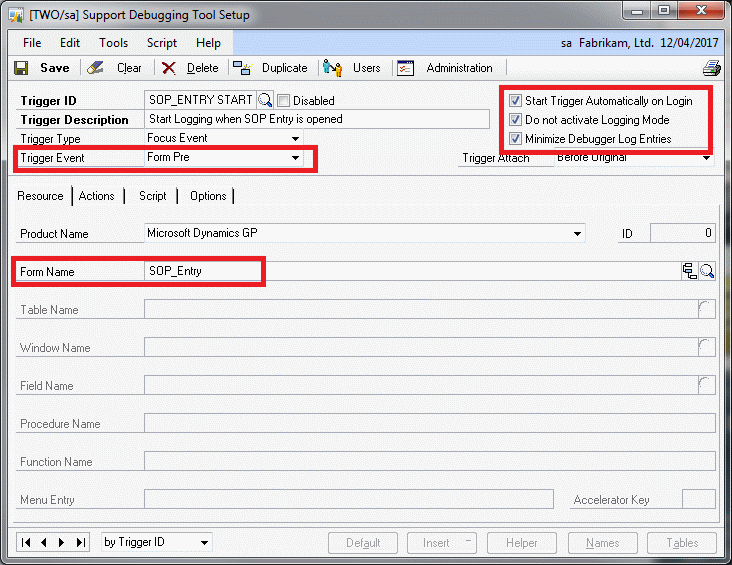
Start trigger Resource settings
 Start trigger script using helper function
Then create another trigger for the end event and user the conditional script to call the MBS_Logging_Stop helper function.
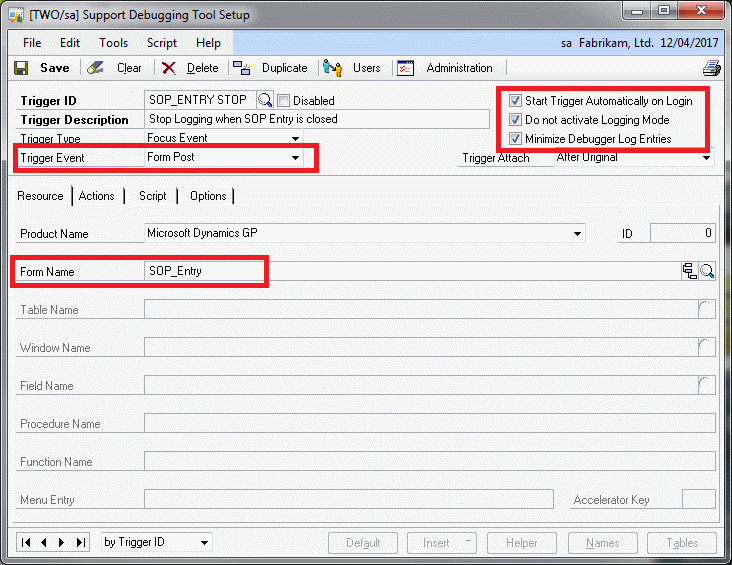
Stop trigger Resource settings
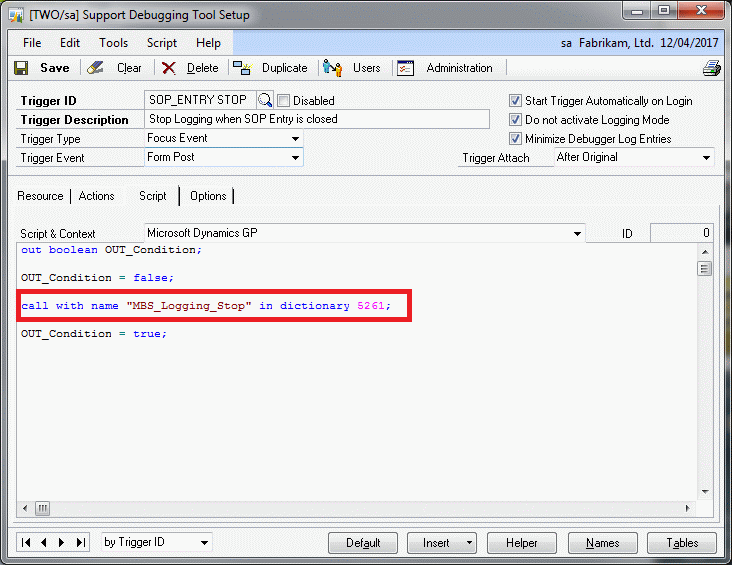
Stop trigger script using helper function
The Debugger Settings XML file for the SOP_Entry automated start and stop example are attached as an archive at the bottom of this article.
Notes:
- The Non-Logging triggers will start after login and wait for the defined events to occur, when the events occur the trigger scripts will execute the helper functions.
- No options on the Actions tab need to be enabled on the triggers as we just want the script to run and control Manual Logging Mode using the helper functions.
- You can specify the users and/or companies for the trigger to start for by clicking the Users Button. This will allow control of what users and/or companies will have logging activated.
- Debugger Setup Mode (in the Dex.ini Settings window), must not be enabled as this will stop triggers from starting automatically.
- To confirm the triggers have started, use the Automatic Debugging Mode Status window (open it using the Automatic Debugger Mode hyperlink or the Options >> Automatic Debugger Mode Status from the Support Debugging Tool main window).
- To disable the Non-Logging triggers, use the Unregister Button at the bottom of the Automatic Debugging Mode Status window.
- All triggers must be disabled before you can get back to the Setup Automatic Debugger Mode window.
Note: If this method is used on a procedure which in turn calls a SQL Stored Procedure (known as a prototype procedure) and SQL Profile Tracing is enabled, you can capture a trace specifically targetted at a single SQL Stored Procedure.
Manual Start with different Logging Types
If you want to start Manual Logging Mode using different Logging Types to those defined in the Administrator Settings window, you can use the Automatic Debugger Mode DEFAULT trigger. Just leave the Trigger Type unselected and set the Logging Types as desired on the Options tab.
Setup Automatic Debugger Mode window
Then manually start Automatic Debugger Mode from the main Support Debugging Tool window using Turn On Automatic Debugger Mode >> DEFAULT only. This will start Automatic Debugger Mode with no triggers which then drops back to Manual Logging Mode. Turning off Manual Logging Mode works as normal.
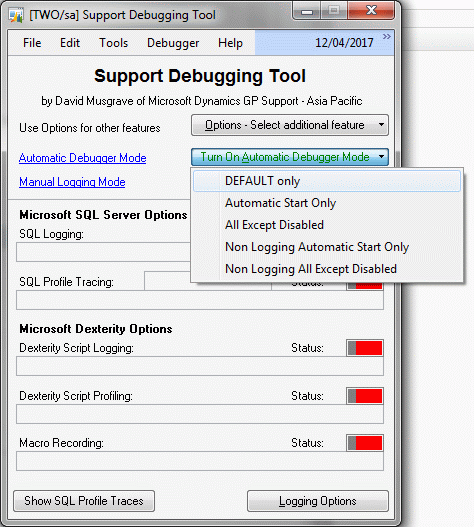
Support Debugging Tool main window
As you can see, there are many options for controlling Manual Logging Mode.... the choice of which to use is all yours.
David