How to configure SQL Profile Tracing using the Support Debugging Tool

Following the release of Build 16 of the Support Debugging Tool, I want to take you through how to configure the SQL Profile Tracing functionality so you can gain the benefits of this awesome feature.
The Support Debugging Tool has always been able to capture a DEXSQL.LOG of the communication between the Dynamics GP Application and the SQL Server, but when a Stored Procedure is called on the SQL Server, we lose visibility of what is actually happening at the SQL Server. Now with SQL Profile Tracing we can see exactly what is happening at the server as well and match this information with other logs we have at the user interface, Dexterity application and SQL Server levels.
This information is available from the PDF User Guide that comes with the Support Debugging Tool in the archive file. The PDF should be installed along with the CNK file so that pressing F1 for help when on a Support Debugging Tool window will open the guide for you.
Below are step by step instructions to configure the recommended settings for SQL Profile Tracing:
- On the SQL Server machine create a folder on a local drive for where the SQL Profile Trace files will be stored while they are being created. Note this local path for later.
- Share this local folder on the network, so that all Microsoft Dynamics GP users will have Full Control to the folder. Note this network UNC path for later.
- Create a user (for example: SQLTraceUser) to be used by SQL Profile Tracing system. The user can be a local user on the SQL Server or a domain user, but needs local Administrator rights on the SQL Server machine. It is recommended to set the password to not expire. Note the User ID and password for later.
- Log into Microsoft Dynamics as ‘sa’ or a user with similar permissions.
- Open the Support Debugging Tool main window (Microsoft Dynamics GP >> Tools >> Support Debugging Tool).
- From the Support Debugging Tool main window select Options >> Dex.ini Settings.
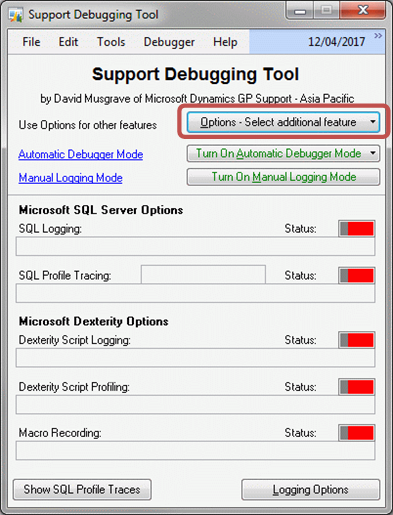
- From the main window select Options >> Administrator Settings to open the Administrator Settings window.
NOTE: If the Administrator Settings choice is not available on the menu, then Advanced Mode is not yet enabled. Please enable Advanced Mode using the Enable Debugger Advanced Mode Features from the Debug tab of the Dex.ini Settings window.
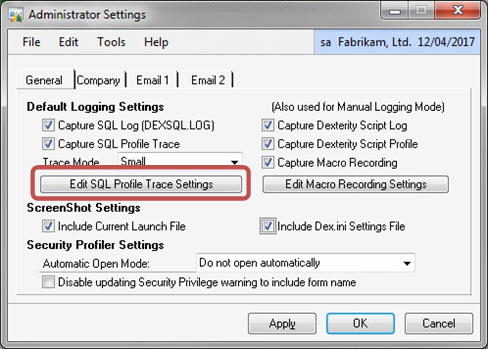
- From the Administrator Settings window, on the General tab, click Edit SQL Profile Trace Settings to open the SQL Profile Trace Settings window.
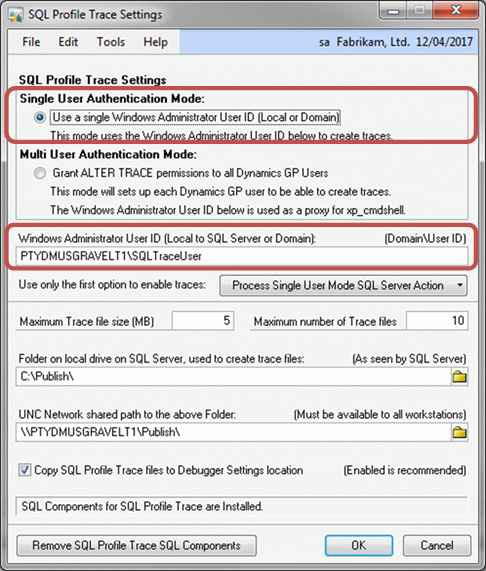
- On the SQL Profile Trace Settings window, make sure Single User Authentication Mode is selected. In this mode only the single user created earlier will need permissions to create SQL Traces and the permissions for individual users do not need to be changed or elevated.
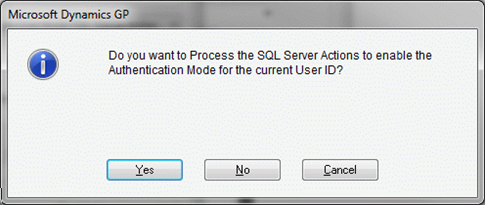
- Enter the user created previously and press tab. The system will then ask if you want to process the SQL Server Actions to enable the Authentication Mode, click Yes.
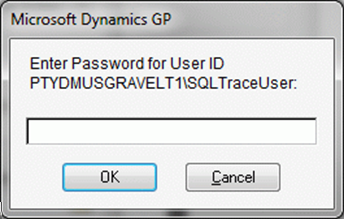
- As each step of the SQL Server actions needed to enable the Authentication Mode are completed a desktop alert will be displayed. You will also be asked for the password for the user for the Enable xp_cmdshell proxy account step. The password is not validated at this time, so please ensure it is entered correctly.
NOTE: To see the list of individual steps for enabling or disabling the Authentication Mode, click the Process Single User Mode SQL Server Action or Process Multi User Mode SQL Server Action button. You can select to manually run all of the steps or select individual steps from the list.
- You can change the Maximum Trace file size and Maximum number of Trace files if desired, or just leave the default values.
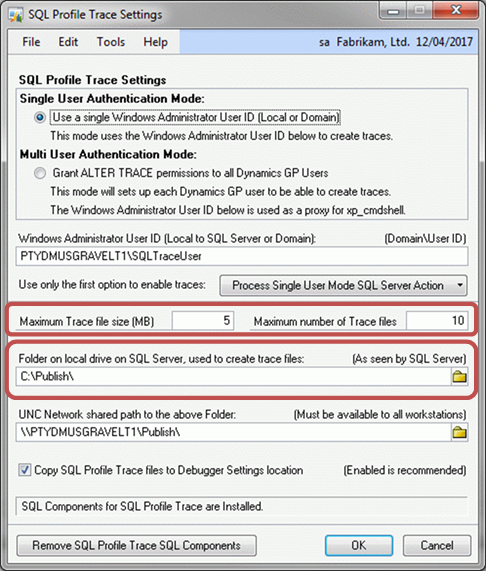
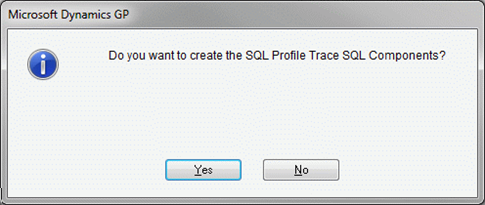
- Enter in the Local Path set up previously (as created in step 1) and press tab. The system will then ask if you want to create the SQL Profile Trace SQL Components, click Yes to create the stored Procedures in the DYNAMICS system database.
- Enter the UNC Network Path set up previously (as created in step 2) and press tab.
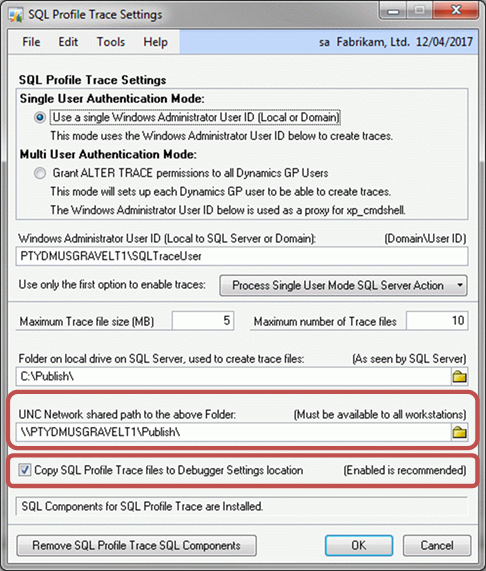
- Make sure the Copy SQL Profile Trace files to Debugger Settings location option is enabled. This will copy the completed trace files from the SQL Server to the folder used for the Debugger Settings and logs.
- Click OK to save the settings and close the SQL Profile Trace window.
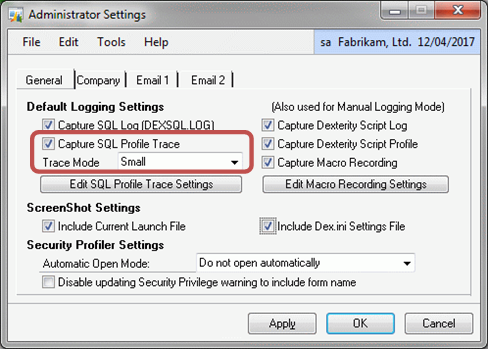
- On the Administrator Settings window, on the General tab, enable the Capture SQL Profile Trace option and set the desired Trace Mode (use Small, if unsure). This will enable SQL Profile Tracing for Manual Logging Mode and as the default value for Automatic Debugger Mode.
- Click OK to save the settings and close the Administrator Settings window.
That's all folks.
Now when logging (both Manual Logging Mode and Automatic Debugger Mode) you have the option to capture a SQL Profile Trace as well as a DEXSQL.LOG, Dexterity Script Profile, Dexterity Script Log and a Macro recording.
David