[PowerShell Script] PowerDbg v4.0 - Using PowerShell to Control WinDbg
Good news! Here’s the newest PowerDbg library. This version is more stable and has more features. Let me tell you about them and how to install it.
New Features
- Send-PowerDbgCTRL-BREAK / Send-PowerDbgResumeExecution
If you’re wondering why do you need these cmdlets I can see at least one scenario: software testing.
For instance, let’s suppose you’re testing software and running an automated test during night.
If you want to run WinDbg, start a few WinDbg commands and collect a dump file. You can use Performance Monitor Alerts and a cmd/bat file that starts WinDbg. It’s that simple.
However, if you want to collect dumps every two hours, run a few WinDbg commands and then, based on the output of these commands, run other commands and save the information using a specific file format, which limits you to using Performance Monitor.
For this kind of scenario you can use a PowerShell script that uses Send-PowerDbgCTRL-BREAK, then send the commands you want to the debugger through Send-PowerDbgCommand and, finally, use Send-PowerDbgResumeExecution to resume the execution. More on that below:
- Parse-PowerDbgGCHANDLELEAKS
This cmdlet parses the output of !sos.GCHandleLeaks. The output is a CSV file with two fields: the GC Handles and the object associated with each handle.
It means you can easily extract the object from the handle.
Warning! If you’ve used this command before, you know it takes A LOT of time to run, so be forewarned.
- Parse-PowerDbgDUMPOBJ
This cmdlet parses the output of !sos.DumpObj. The output is a CSV file containing the main fields.
If the object is a String, the string message will be there, too.
- Parse-PowerDbgDD-L1
This cmdlet parses the output of dd poi(<address>) L1 or dd <address> L1.
It’s just a shortcut to get the value without having to parse it. It’s a time saver.
Additional changes:
- Increased default timeout to 1 hour. This is to avoid errors when running slow commands like GCHandleLeaks
- Fixed three subtles bug in Send-PowerDbgCommand. It’s more stable now.
How to Install PowerDbg
a) Download PowerShell.
b) From PowerShell, type $profile:
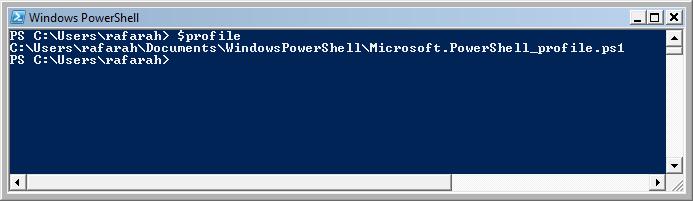
c) Now, create the folder and file according to the output of the command above.
d) Copy the PowerDbg source code (below) to the Microsoft.PowerShell_profile.ps1 file.
e) Close PowerShell and open it again. At this point you should be able to call any PowerDbg cmdlet from your PowerShell console window. However, you need one more step before doing that.
f) Open WinDbg. Attach it to an application or dump file. Reload the symbols using .reload, load the extension sos.dll with .loadby sos mscorwks, and use .wtitle PowerDbg to change the WinDbg title, allowing PowerDbg to send the command to WinDbg.
How to Use the New CmdLets
- Send-PowerDbgCTRL-BREAK / Send-PowerDbgResumeExecution
Create a script file using the following code to see how to use these two cmdlets. Now attach WinDbg to a running application, setup the symbol path, let the application run with WinDbg attached and run the script below which is going to show all threads call stacks every 50 seconds. To do that the script stops the execution, displays the threads and their stacks and resumes the execution.
# Simple script that shows you how to break into the debugger, run some commands, and resume the
# execution.
# Infinite loop... you want to stop it? Use CTRL-C.
while($true)
{
write-Host "`nWaiting for 50 seconds...`n" -foreground Green -background Black
# Wait for 50 seconds.
Start-Sleep 50
# Break into the debugger, sending the control from the application to the debugger.
Send-PowerDbgCTRL-BREAK
# Let's play with some commands. Let's get the call stack for each thread.
Send-PowerDbgCommand "~* kbn 1000"
# Now we parse the output.
Parse-PowerDbgK
# Converts the CSV file to a HashTable
$output = Convert-PowerDbgCSVToHashTable
# Loops through all threads and displays the stack.
for([int] $i = 0; $i -lt ($output.Count - 1); $i++)
{
# Replace the internal frame delimiter by new line and displays the stack.
write-Host $output["$i"].Replace($global:g_frameDelimiter, "`n") -foreground Green -background Black
}
Write-Host "Resuming execution..." -foreground Green -background Black
# Resume execution, giving control to the application again.
Send-PowerDbgResumeExecution
}
- Parse-PowerDbgGCHANDLELEAKS
Example:
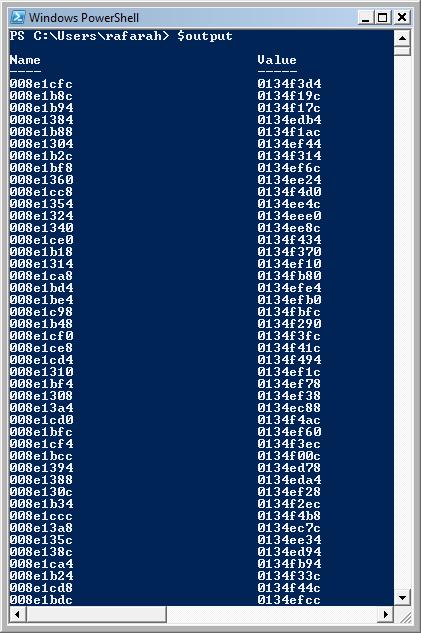
Send-PowerDbgCommand "!GCHandleLeaks"; Parse-PowerDbgGCHandleLeaks; $output = Convert-PowerDbgCSVToHashTable
After this command $output will have the handles and objects:
For a detailed example see my next article. J
- Parse-PowerDbgDUMPOBJ
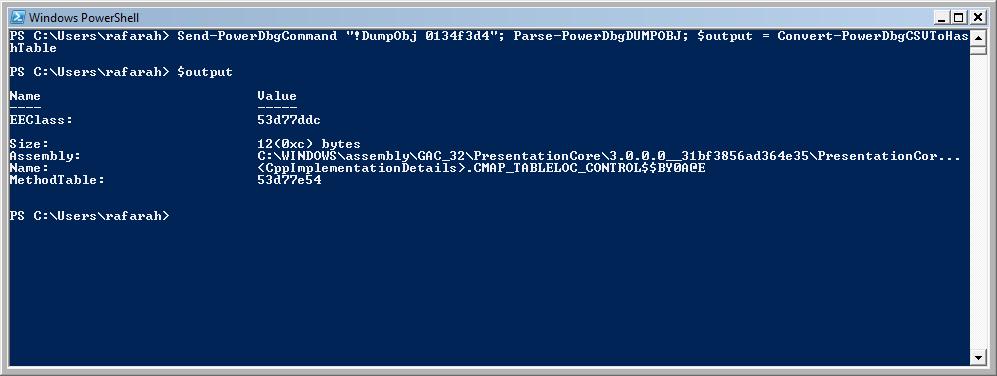
Here’s how to use it:
Send-PowerDbgCommand "!DumpObj 0134f3d4"; Parse-PowerDbgDUMPOBJ; $output = Convert-PowerDbgCSVToHashTable
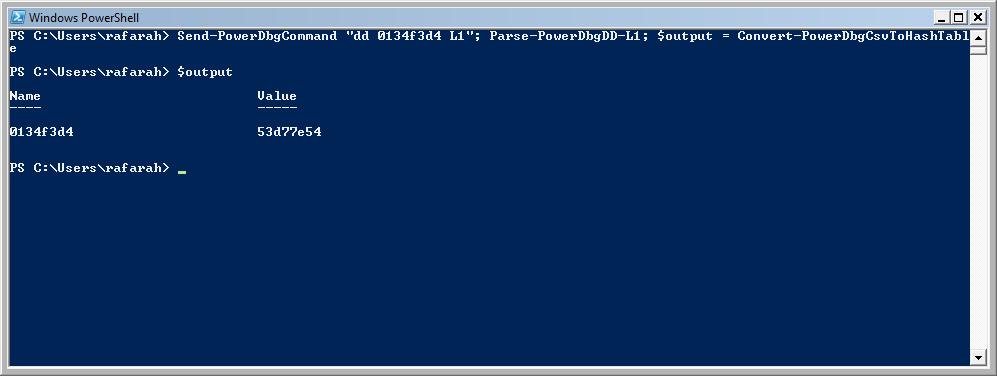
- Parse-PowerDbgDD-L1
Send-PowerDbgCommand "dd 0134f3d4 L1"; Parse-PowerDbgDD-L1; $output = Convert-PowerDbgCsvToHashTable
Here you can download the source code from PowerDbg v4.0.