Special Command: Using ~, the Thread Identifier
When debugging, most of the time, you have to see all stacks for all threads or to set the context for a specific thread in order to analyze it.
To do that you use the ~ command.
According to the WinDbg documentation we have:
Thread identifier |
Description |
~. |
The current thread |
~# |
The thread that caused the current exception or debug event |
~* |
All threads in the process |
~ Number |
The thread whose ordinal is Number |
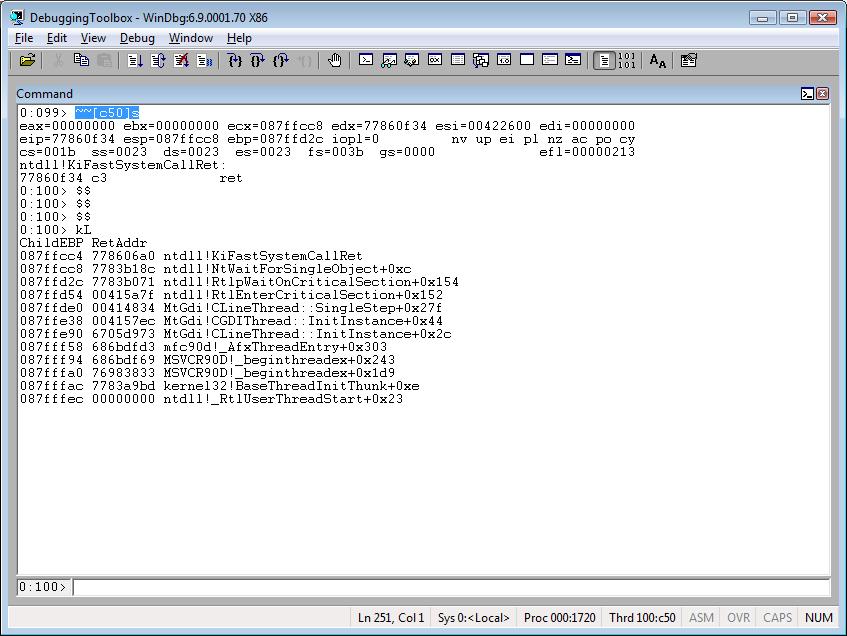
~~[ TID ] |
The thread whose thread ID is TID (The brackets are required, and you cannot add a space between the second tilde and the opening bracket.) |
This command is very easy to use, but it has some nuances. Otherwise, I wouldn’t be writing about it. ;-)
Let me show you the basic usage first and then a more advanced usage.
The s after the thread number, below, forces the debugger to change the thread context. In other words, all k* commands are going to operate on the new thread.
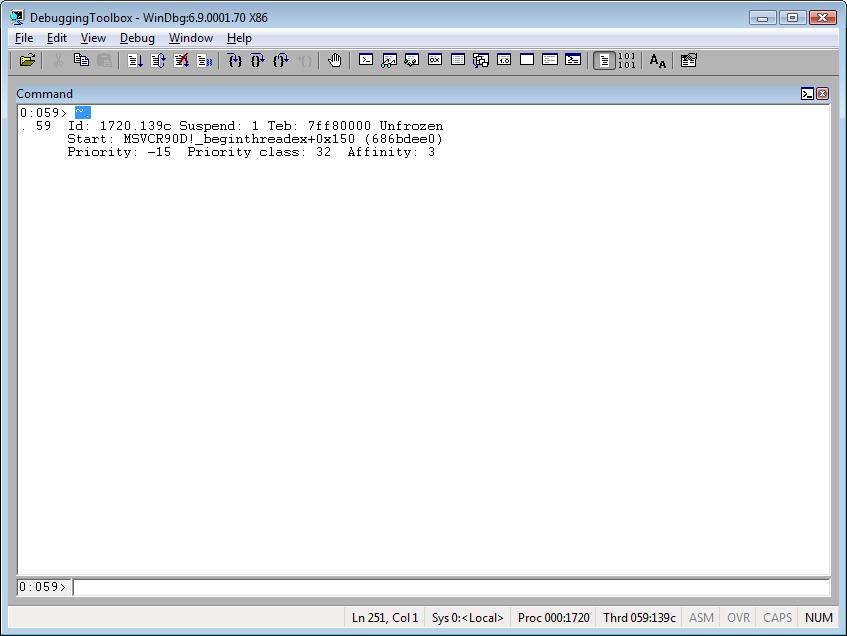
~.
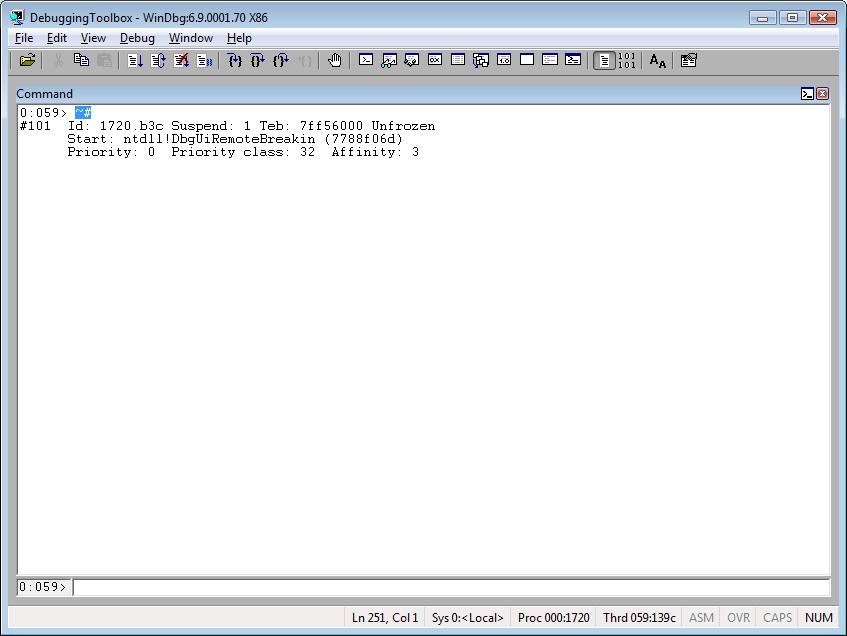
~#
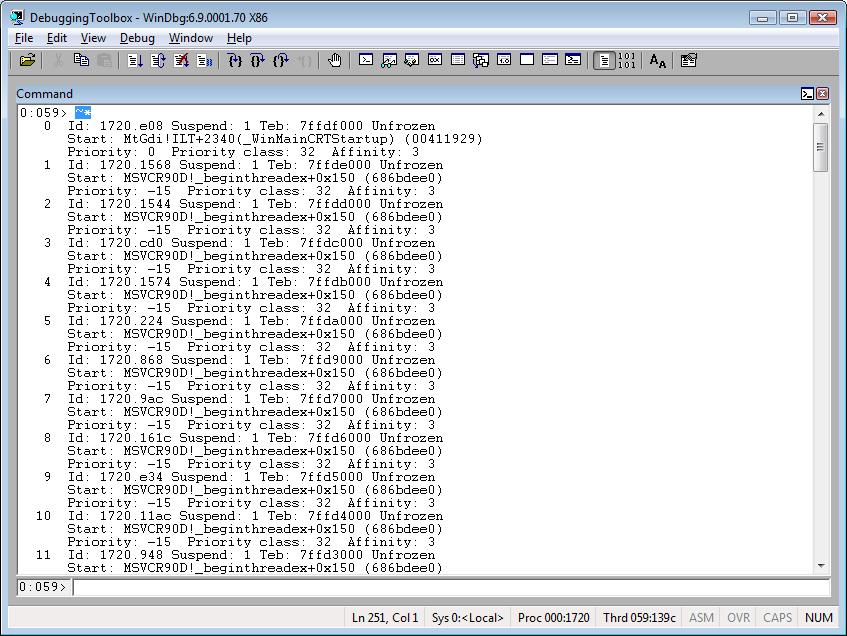
~*
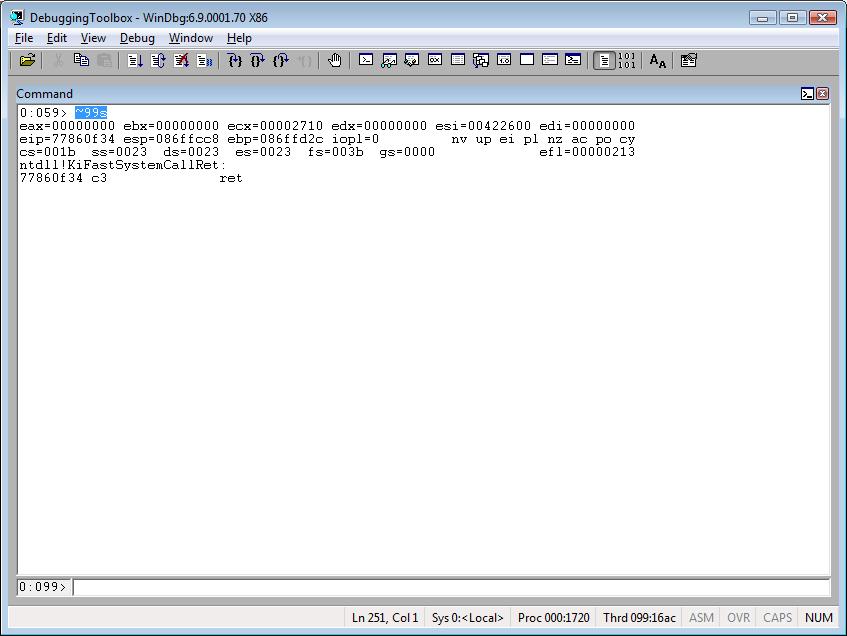
~<Number>s
~~[TID]s
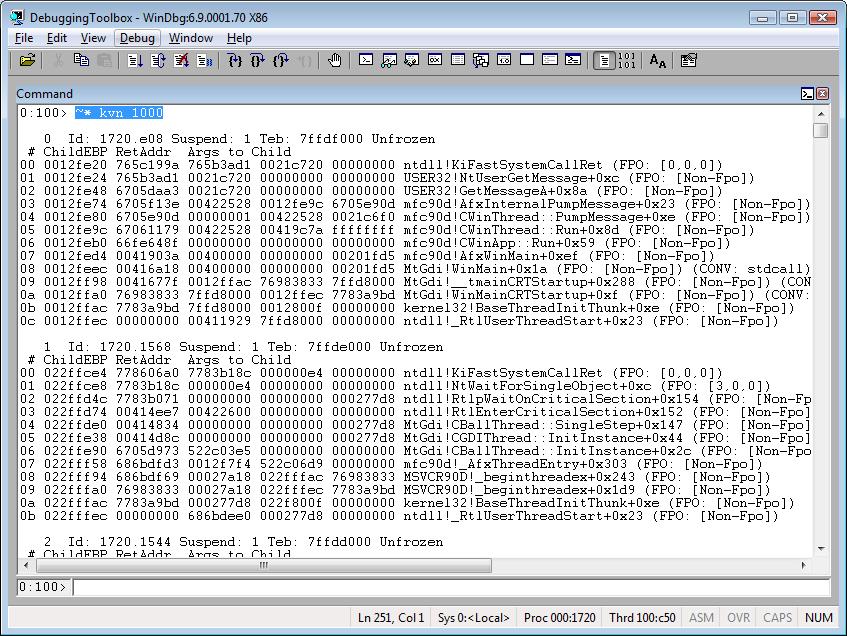
Now, things are going to be more interesting. I’m going to execute commands for each thread.
~* kvn 1000
~* e !gle
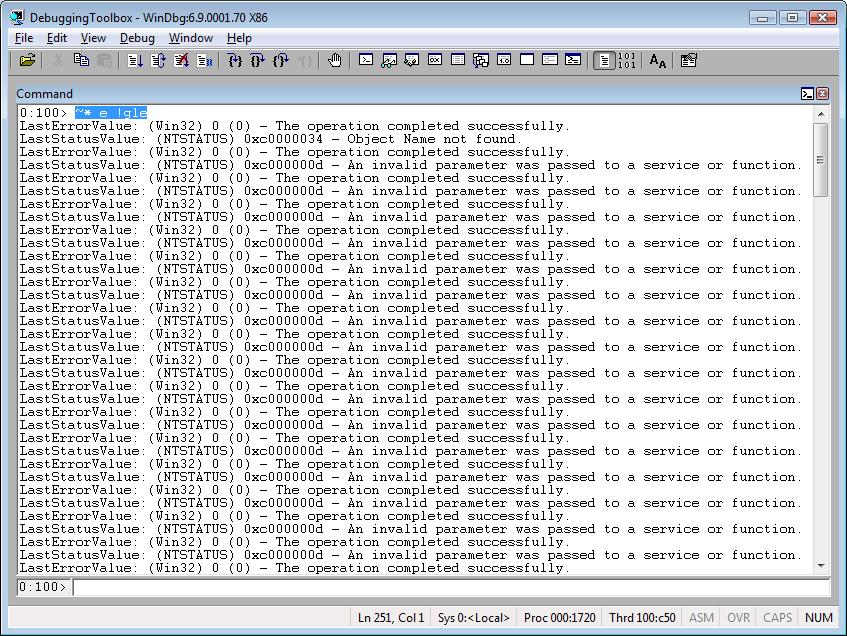
Did you notice the e? J
The e is necessary when you need to execute a debugger extension or commands that start with a dot (.)
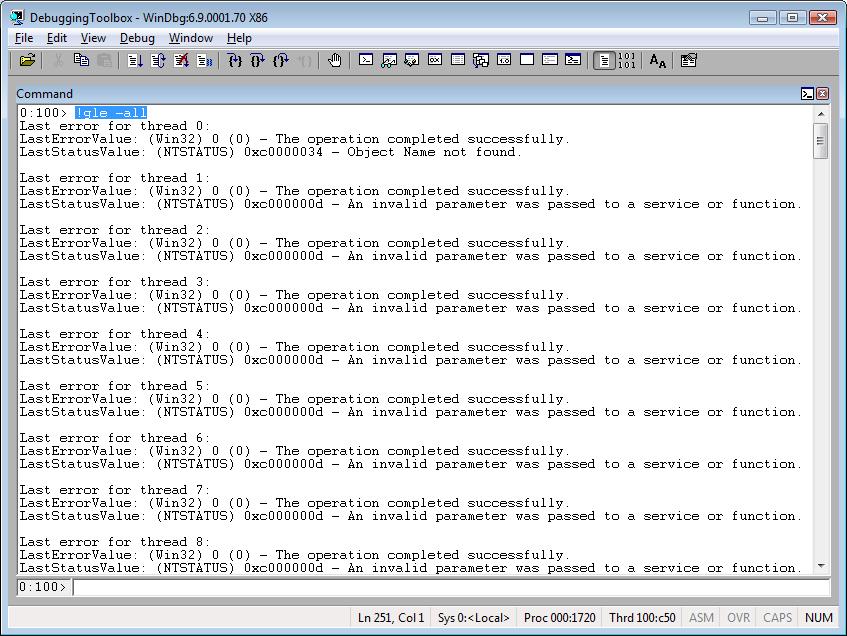
Tip: The last command above is just to demonstrate thee usage. It’s way better and simpler to use this approach:
!gle -all
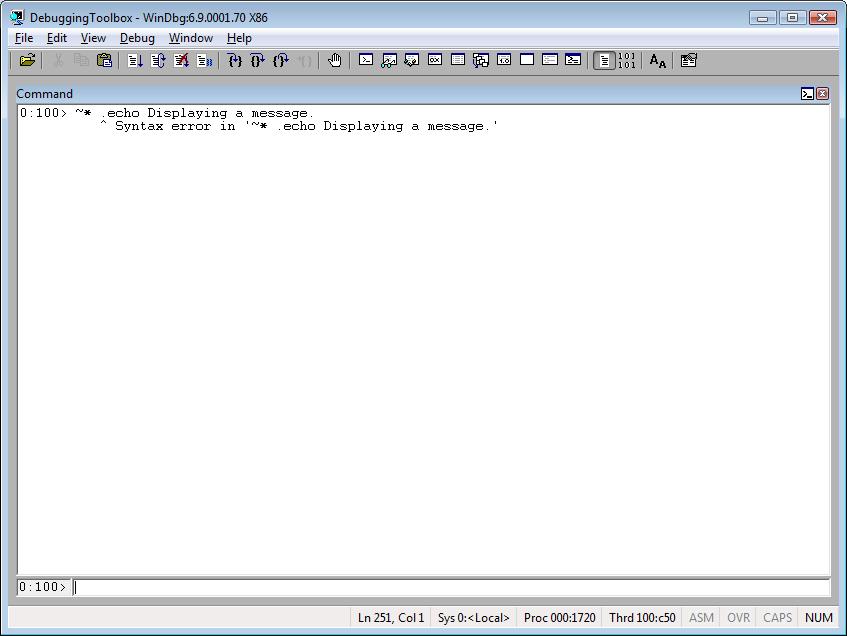
Look what happens if you don’t use e when you need to:
~* .echo Displaying a message.
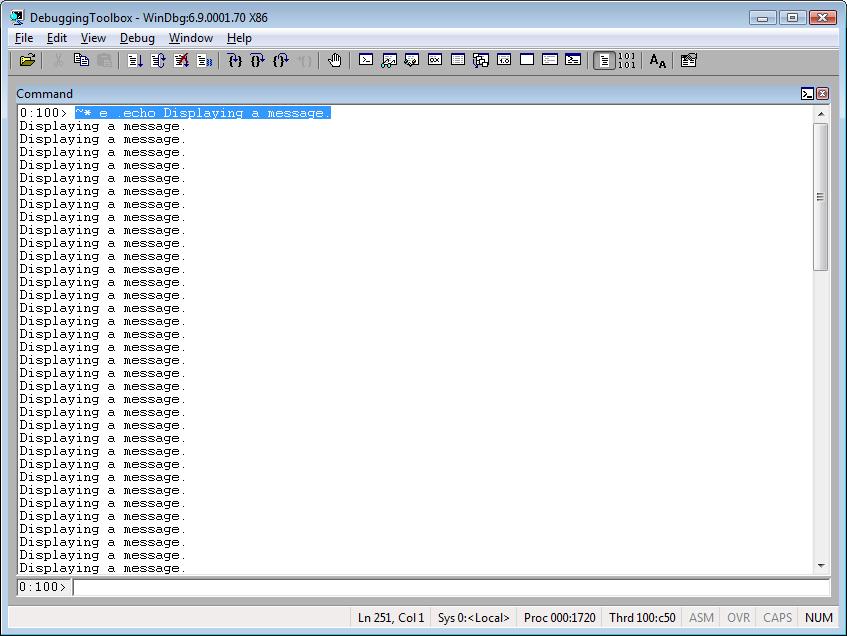
This works fine:
~* e .echo Displaying a message.
; is used to aggregate commands, so you can do this:
~* e .echo Thread ID:; r @$tid; .echo =================
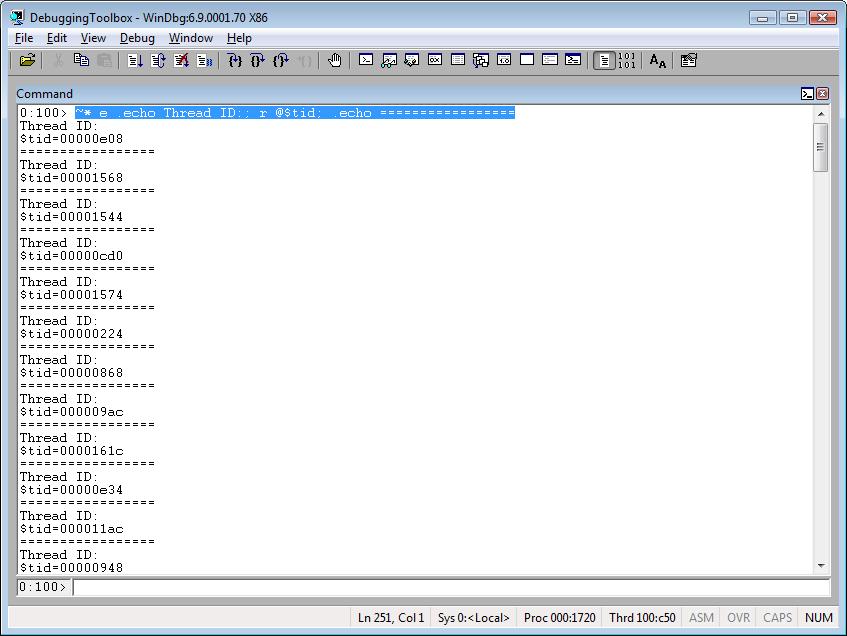
$tid gives you the thread ID. In another article I’ll discuss registers and pseudo-registers.