Special Command: Analyzing the Memory and Stack Using the dp* Command
When you need to see the raw call stack and memory, you have plenty of options. You can even leverage the WinDbg GUI to see them.
Here I’m going to show you how to do that.
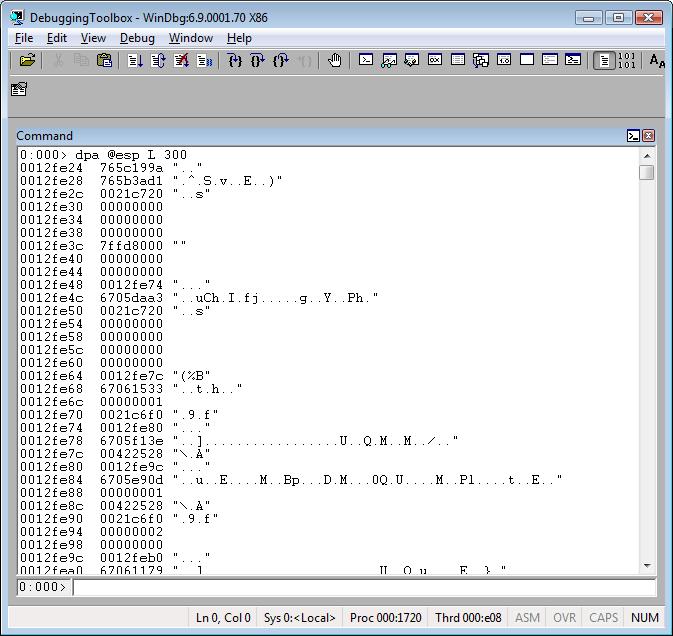
dpa <address> L <range>
dpa <startAddress> <endAddress>
Using this command allows you to see a range of ASCII strings, for example, strings from the call stack.
Example:
dpu <address> L <range>
dpu <startAddress> <endAddress>
When using this you can see a range of Unicode strings, for example, strings from the call stack.
Tip: poi(@$teb+0x8) is the beginning of the call stack.
poi(@$teb+0x4) is the end of the call stack.
Example:

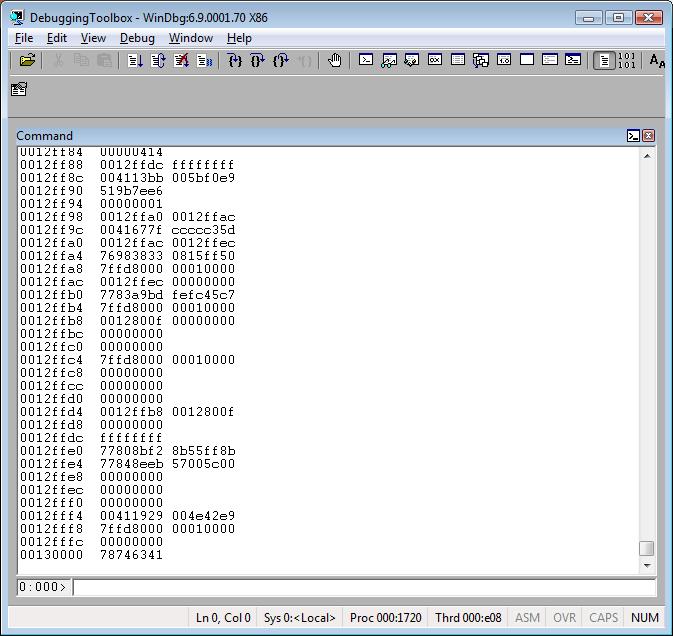
dps <address> L <range>
dps <startAddress> <endAddress>
This command is very useful because you can see the raw call stack.
Tip: You can see the stack even if it's corrupted. You can also use dps to see data from the heap memory. J
Example:
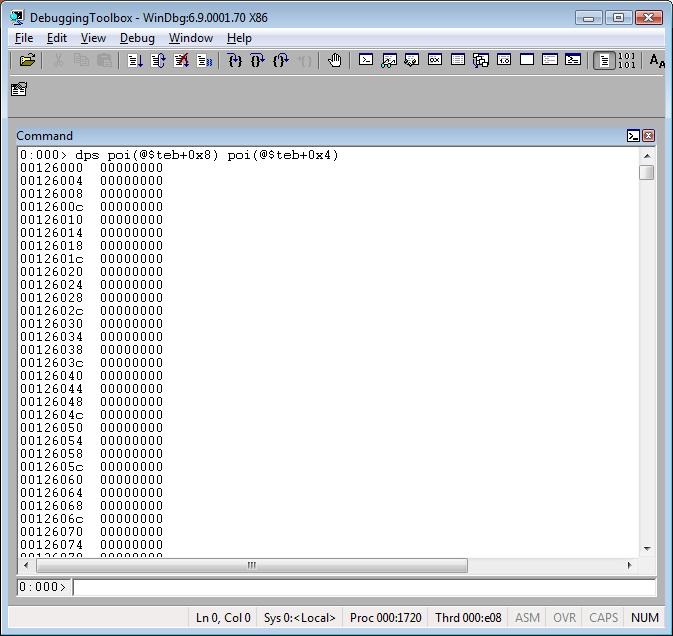
Tip: Do you see the 00000000 above? Remember, the stack grows from the higher address to the lower address. So, the beginning of the stack is still empty, which means the stack isn't totally used. Because the image above is just a screenshot you cannot see the complete call stack. To do that I should have scrolled down the window and collected other screenshots. J
dpp <address> L <range>
dpp <startAddress> <endAddress>
This is also another very useful command. It displays pointers! By using it you can see pointers that are being referenced from the call stack. I use it a lot!
Tip: When using this command, you can find virtual pointer tables that appear in a specific memory range. It’s a great approach to identify the classes for the virtual pointer tables.
Example: