Special Command: Analyzing and Reconstructing the Stack Using the k* Command and Its Variations
I’m starting a new series of articles focused on explaining special commands and showing how they can be used. You can read about WinDbg commands using the WinDbg documentation; however, sometimes you want to see the output of a specific command or you want to know when to use a specific command variation. Therefore, with these blog articles about special commands, you’ll have additional documentation that should help you during your debugging session. I will not explain all the command variations; only those that I think are important and useful.
So, first, let’s see some important k* variations and when to use them.
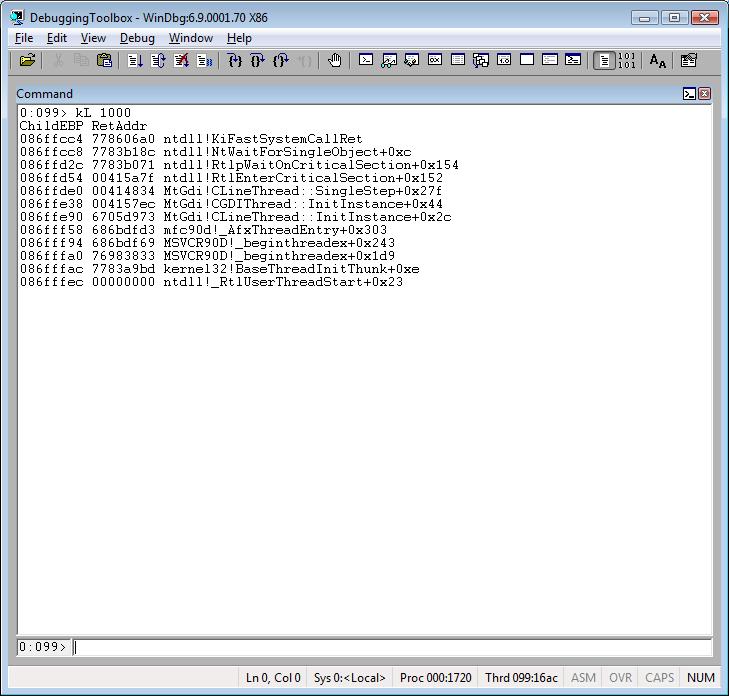
kL 1000
kL gives you the stack without any additional information. I use kL whenever I need to send a call stack to my customers and, at the same time, avoid confidential information like parameters or source code line numbers.
Tip: I always use 1000 to force the command to display the entire call stack. So 1000 is sufficient 99% of the time. Another approach is to use .kframes.
Example:
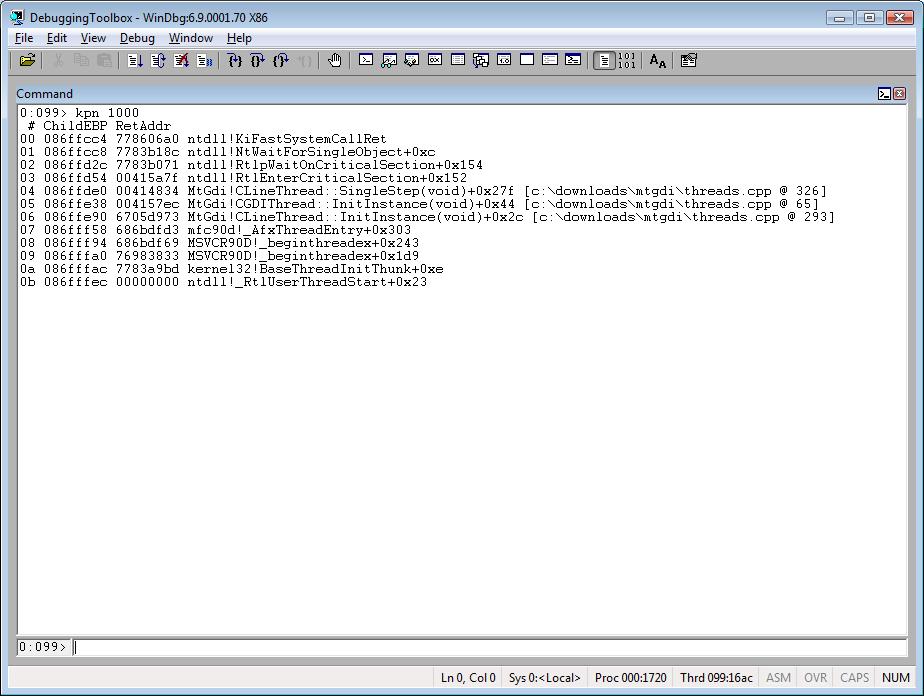
kpn 1000
I like to use the n variation when using kb, kP or kp because it shows you the frame number.
This variation shows you all the parameters for each method/function.
Tip: It’s useful when you have private symbols. Private symbols give you information like parameters and source code line numbers. If you have only public symbols, you may want to use kbn, explained below.
Example:

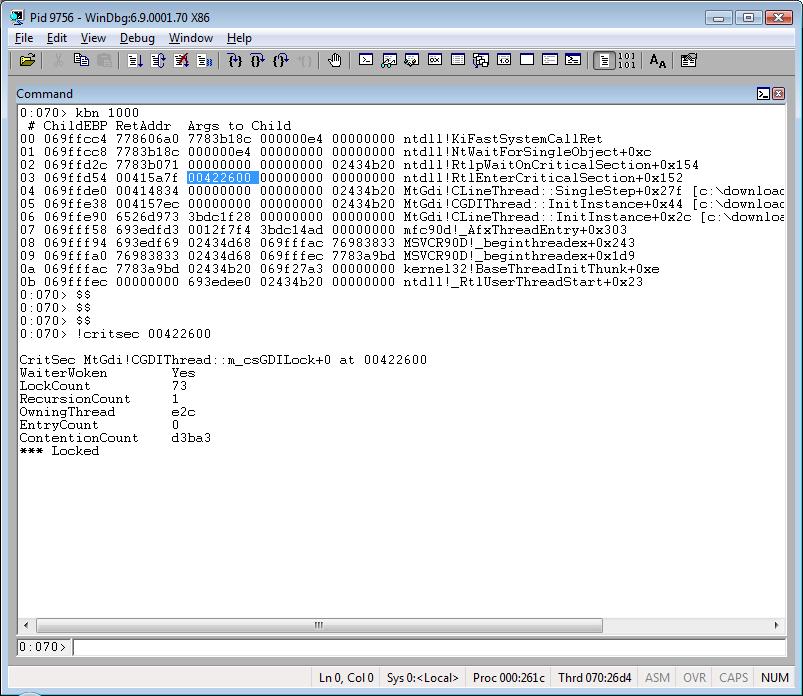
kbn 1000
This variation shows you the first three parameters passed to each function/method in the stack trace.
Tip: Using it when you have public symbol should help you to figure out the first three parameters.
Example:
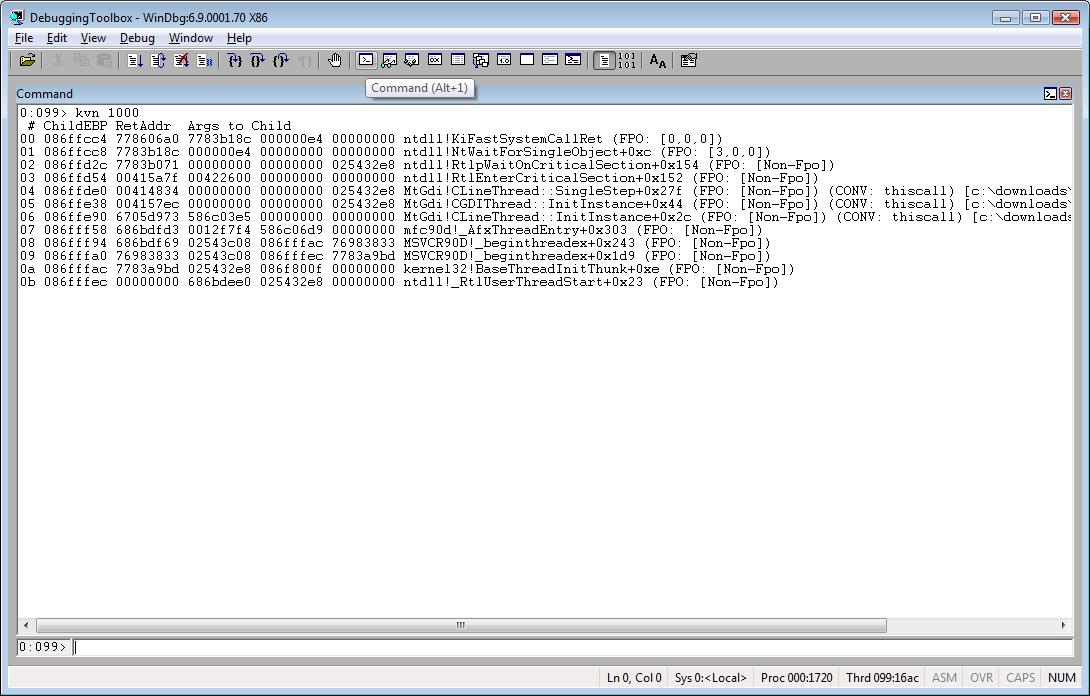
kvn 1000
If your stack is using Frame Point Optimization, you may want to use kvn to see the number of parameters.
According to the WinDbg documentation we have:
FPO text |
Meaning |
FPO: [non-Fpo] |
No FPO data for the frame. |
FPO: [N1,N2,N3] |
N1 is the total number of parameters. N2 is the number of DWORD values for the locals. N3 is number of registers that are saved. |
FPO: [N1,N2] TrapFrame @ Address |
N1 is the total number of parameters. N2 is the number of DWORD values for the locals. Address is the address of the trap frame. |
FPO: TaskGate Segment:0 |
Segment is the segment selector for the task gate. |
FPO: [EBP 0xBase] |
Base is the base pointer for the frame. |
Tip: Usually you’ll see FPO only when debugging optimized C/C++ code for 32 bits.
Example:

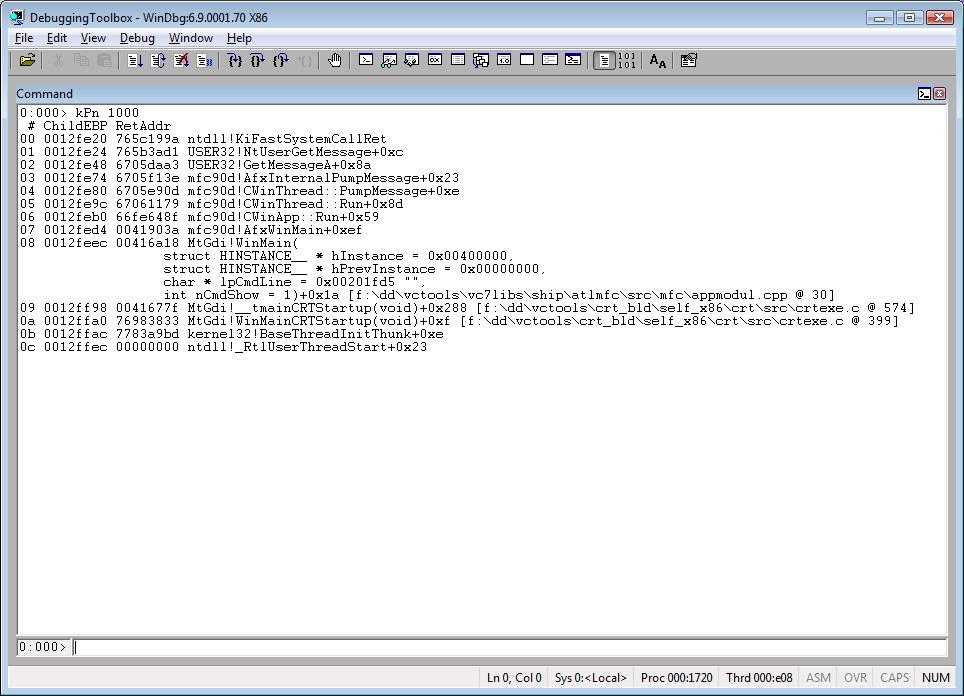
kPn 1000
When using this variation you’ll see only one parameter for each line and not side by side like kpn.
Tip: Use it when you have stack frames with many parameters. It should be easier to read them.
Example:
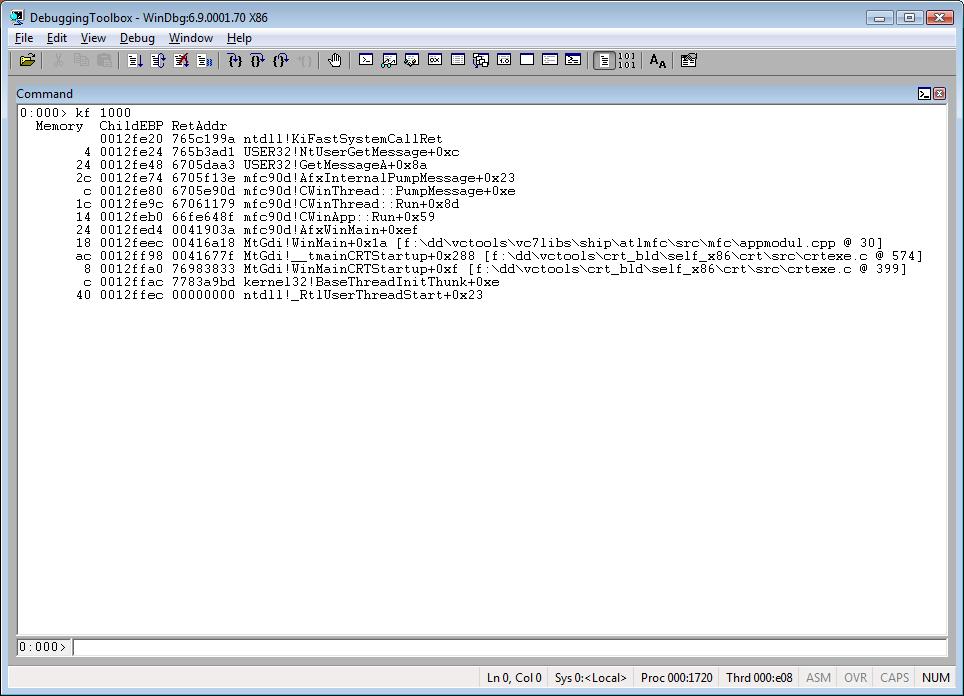
kf 1000
Displays the distance between adjacent frames. This distance is the number of bytes that separate the frames on the actual stack.
Example:
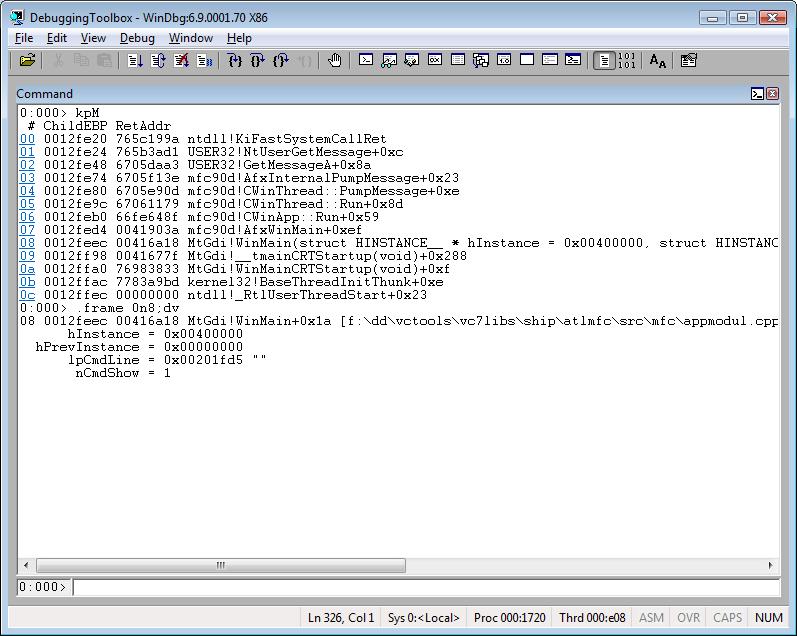
kpM
This command uses DML (Debugger Markup Language) to display the call stack. Besides that, it gives you hyperlinks for each frame. When you click on a specific hyperlink, it shows you the local variables for this particular frame. This is cool! J
Example:
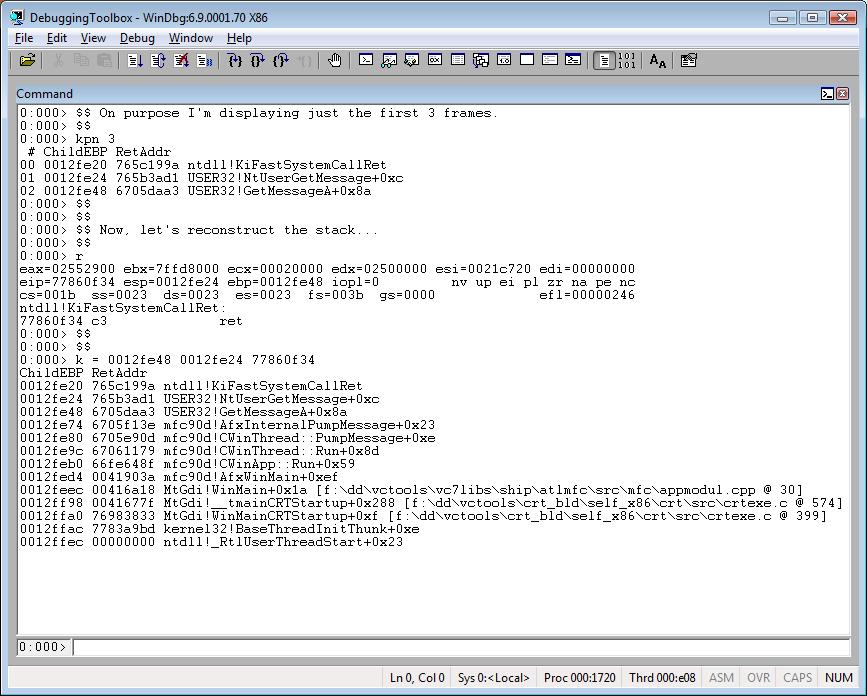
Reconstructing a Corrupted Stack
The k* command is also useful for reconstructing a corrupted call stack.
To do that you need to use:
kbn = BasePointer StackPointer InstructionPointer
To show you the technique, I’m going to use a regular call stack. However, I’m going to display the first two frames, and then I’m going to get the remainder stack frames using the technique.
If you want to learn more about it, check out this book.
Example: