HTTP debugging for Silverlight developers (Mac OS X edition)
Many posts have been written about how to debug problems with issuing HTTP requests from Silverlight applications, particularly in the context of web services and WCF (see for example Debugging Web Service Usage in Silverlight 2 or Faults and Exceptions when using Web Services in Silverlight 2 ). As they point out there are severe limitations to what information is passed to applications in case of non-200 HTTP status codes. And they also point out that sometimes you need to know what requests and responses are exactly sent over the wire in order to figure out what's going on, usually mentioning Fiddler for doing so. It is a very powerful tool allowing you to not only monitor HTTP traffic from certain applications but also letting you manipulate requests and responses (which is probably more than you need for "simple" debugging anyway).
This is all great until you hit an issue that only seems to repro on that other platform. Using a Windows application to debug on Mac OS X is impractical at best (impossible would be the better word in this case though). So, what to use instead? For my personal application development I use Wireshark which some of you may have encountered in the past under its old name, Ethereal. There are, however, a couple of differences. Wireshark is open source released under the GPL 2 but more importantly it is a sniffer and not an "HTTP debugging proxy". This means that in comparison to Fiddler it does not necessarily "know" HTTP as well since to Wireshark it is just another high-level protocol. It also means that a typical Wireshark capture picks up much more traffic than we care for (not using promiscuous mode in case of shared medium topologies at least reduces the amount of noise in the capture).
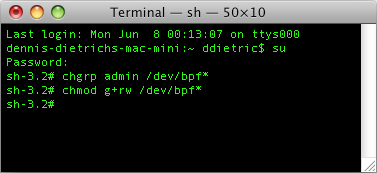
Wireshark is an X11 application so be sure that you have X11 installed and that it is up-to-date. Also, the OS X version of Wireshark uses BPFs to capture network traffic; however, access to those is denied for all users except for root (see also Enabling and using the "root" user in Mac OS X ) so their permissions need to be changed first. This has to be redone after every reboot. While automatically making these changes during every startup or login has some appeal to it I prefer making them manually when they are needed. Given the nature of BPFs, keeping them locked down seems like a good idea to me.
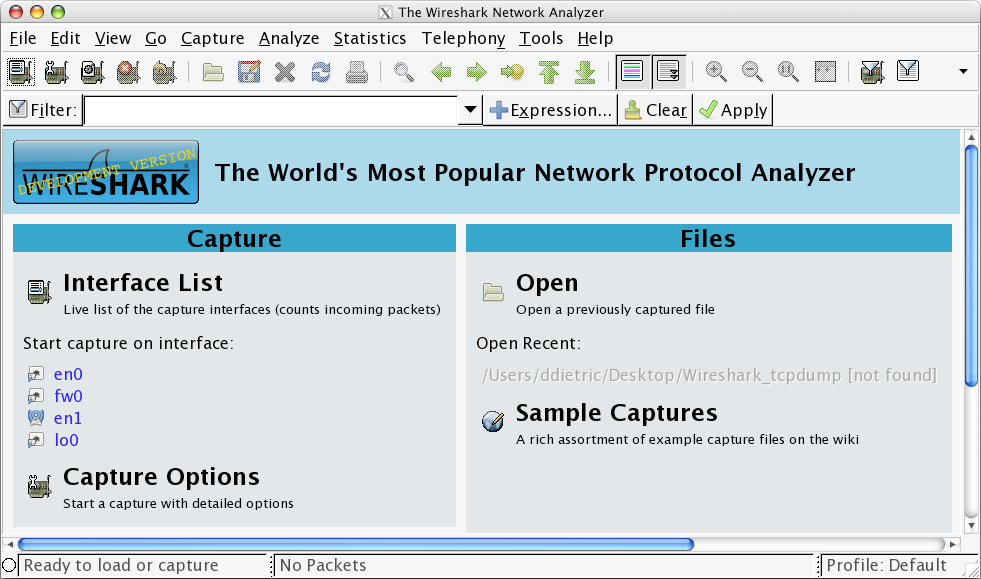
Now we're finally ready to start Wireshark. The first start of the application can take a while (if I remember correctly this is due to X11 filling its font cache) so be patient. Also, all builds I have tried so far greet you with a nice pop-up error message. Luckily just ignoring it doesn't cause any trouble at least not in case of what I'm talking about in this post. At this point you can start capturing by simply selecting an interface from the list.
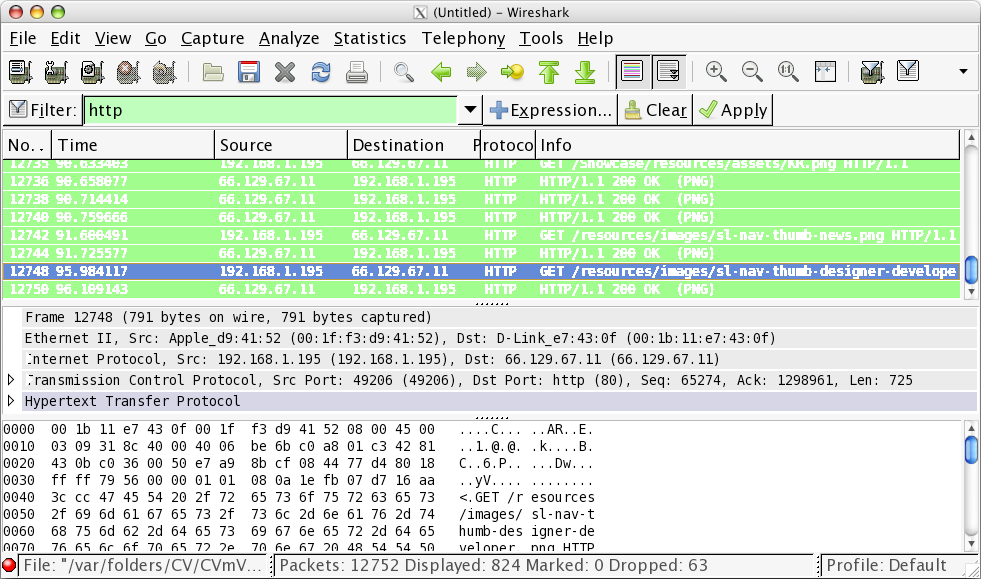
As mentioned before, this will give you much more information than you need since you'll see all traffic sent to/from your machine or all traffic hitting your interface if you are using promiscuous mode which is on by default. The screenshot below indicates 12752 captured packets after about 100 seconds which shouldn't surprise you since unlike Fiddler which is only concerned about HTTP Wireshark is capturing Ethernet frames. The simplest way to get to the information you really care about is to filter for http which is also shown in the screenshot. There's a lot more you can do like filtering for source or destination address so pay a visit to the Wireshark Wiki.
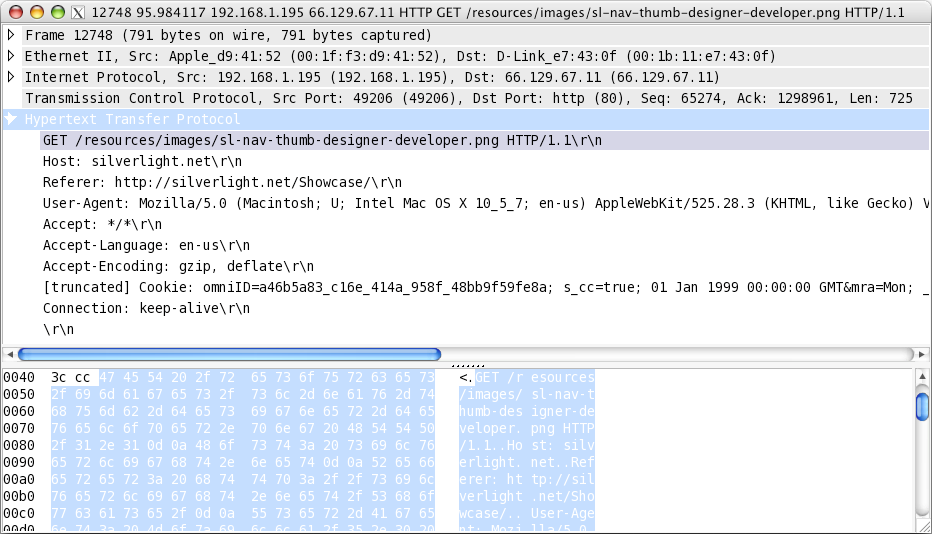
Lastly I'd like to mention that you can view a packet in its own window by selecting the command Show Packet in New Window from the View menu or by simply double-clicking on a packet in case you're running the latest development release.
This posting is provided "AS IS" with no warranties, and confers no rights.