Ask Learn
Preview
Ask Learn is an AI assistant that can answer questions, clarify concepts, and define terms using trusted Microsoft documentation.
Please sign in to use Ask Learn.
Sign inThis browser is no longer supported.
Upgrade to Microsoft Edge to take advantage of the latest features, security updates, and technical support.
Note
Access to this page requires authorization. You can try signing in or changing directories.
Access to this page requires authorization. You can try changing directories.
PowerApps brings you lots of built-in controls and ways to visualize your data with just a few clicks. Sometimes, however, you might want to build custom visualizations that are not quite achievable with only those controls. This article shows one way in which you can create your own custom visualizations. In particular, we will create a radial gauge (circular progress bar) using only an Image control. This is not for the faint of heart, however. Proceed at your own risk :)
NOTE: The technique explained in this article is not officially supported by the product, nor is it easy or friendly to use. You should prefer other supported alternatives when possible. That said, if nothing else suits your needs and this allows you to build the amazing PowerApp you want, then by all means go for it and have fun! I have tested it to ensure that it currently works in all our supported platforms as of this writing.
We use 2 key concepts to achieve our goals in this article:
The idea: Write a PowerApps expression that results in some text which will be the data-uri representation of an SVG image. By setting this expression as the Image property of an Image control, we can dynamically render the SVG content, which can take any valid PowerApps constructs as input. The sample app shows a radial gauge representation that is controlled by a Slider control. Of course, you can create any other visualization with the same approach.
 "data:image/svg+xml,%3Csvg%20xmlns%3D%22http%3A%2F%2Fwww.w3.org%2F2000%2Fsvg%22%20width%3D%22100px%22%20height%3D%22100px%22%3E" &
    "%3Cpath%20fill%3D%22none%22%20style%3D%22stroke-width%3A18%3Bstroke%3Argb%28230%2C230%2C230%29%3Bstroke-linecap%3Around%3B%22%20d%3D%22" &
        "M%20" &
        Text(50-40*Sin(Pi()/4)) & "%20" & Text(50+40*Cos(Pi()/4)) &
        "%20A%20" &
        "40%2040%200%201%201%20" & Text(50-40*Sin(2*Pi()-Pi()/4)) & "%20" & Text(50+40*Cos(2*Pi()-Pi()/4)) &
        "%22%3E" &
    "%3C%2Fpath%3E" &
    "%3Cpath%20fill%3D%22none%22%20style%3D%22stroke-width%3A18%3Bstroke%3Argb%2869%2C204%2C206%29%3Bstroke-linecap%3Around%3B%22%20d%3D%22" &
        "M%20" &
        Text(50-40*Sin(Pi()/4)) & "%20" & Text(50+40*Cos(Pi()/4)) &
        "%20A%20" &
        "40%2040%200%20" & If(Slider1.Value/Slider1.Max>Pi()/(2*(Pi()-Pi()/4)),"1","0") & "%201%20" & Text(50-40*Sin(Pi()/4+2*(Pi()-Pi()/4)*Slider1.Value/Slider1.Max)) & "%20" & Text(50+40*Cos(Pi()/4+2*(Pi()-Pi()/4)*Slider1.Value/Slider1.Max)) &
        "%22%3E" &
    "%3C%2Fpath%3E" &
"%3C%2Fsvg%3E"
You can change the look and feel by looking for the following chunks in the given expression and changing the values of all occurrences to something else. If you change any one of these, make sure you find and replace all occurrences, otherwise things may not work.
Since we are using SVG, the image can be rendered at any resolution without looking blurry. You can resize the Image control to any size you want (just make sure the property ‘ImagePosition’ is set to ‘Fit’) and it will scale as appropriate.
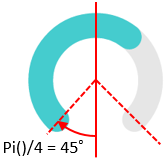
A single character error could prevent this from working, in which case you would get a blank image and no indication of what might be wrong. Should that happen, a helpful tip is to add a TextBox to your app and set its Text property to Image1.Image. This will show you the result of evaluating your expression, and might help you find what’s wrong. For the sample app and when the slider is exactly in the center, this is what it should look like:
NOTE: If you are using Chrome, you can copy the string below and paste it in the address bar of your browser and you will see the radial gauge come up. Browsers too can read data uri's!
data:image/svg+xml,%3Csvg%20xmlns%3D%22http%3A%2F%2Fwww.w3.org%2F2000%2Fsvg%22%20width%3D%22100px%22%20height%3D%22100px%22%3E%3Cpath%20fill%3D%22none%22%20style%3D%22stroke-width%3A18%3Bstroke%3Argb%28230%2C230%2C230%29%3Bstroke-linecap%3Around%3B%22%20d%3D%22M%2021.71572875%2078.28427125%20A%2040%2040%200%201%201%2078.28427125%2078.28427125%22%3E%3C%2Fpath%3E%3Cpath%20fill%3D%22none%22%20style%3D%22stroke-width%3A18%3Bstroke%3Argb%2869%2C204%2C206%29%3Bstroke-linecap%3Around%3B%22%20d%3D%22M%2021.71572875%2078.28427125%20A%2040%2040%200%200%201%2050.0%2010%22%3E%3C%2Fpath%3E%3C%2Fsvg%3E
When URL-decoded and formatted, you can see what the SVG content looks like:
 <svg xmlns="https://www.w3.org/2000/svg" width="100px" height="100px">
  <path fill="none"
        style="stroke-width:18;stroke:rgb(230,230,230);stroke-linecap:round;"
        d="M 21.71572875 78.28427125 A 40 40 0 1 1 78.28427125 78.28427125"></path>
  <path fill="none"
        style="stroke-width:18;stroke:rgb(69,204,206);stroke-linecap:round;"
        d="M 21.71572875 78.28427125 A 40 40 0 0 1 50.0 10"></path>
</svg>
And that's it for now. I mentioned in the beginning that this was not for the faint of heart, and now you can probably see why.
In any case, this opens up many interesting scenarios if you are willing to have some not-very-pretty expressions in your app. What's more, whoever is using your app (perhaps yourself!) won't know about the expressions that are powering the visualization. All they will see is the beautiful UI that you were able to create thanks to PowerApps.
See you next time!
PS: This article was inspired by a question in the PowerApps forums. Thanks nagavital for the questions and keep them coming!
Ask Learn is an AI assistant that can answer questions, clarify concepts, and define terms using trusted Microsoft documentation.
Please sign in to use Ask Learn.
Sign in