Free Chart Controls for .NET: Windows and Web – Handy Links
Even though its been available for more than 6 months, many people have overlooked this little gem. Those that are using it get terribly excited when they discover how easy it is to use the features & capability it offers. So if you need very powerful charts in your application, read on.
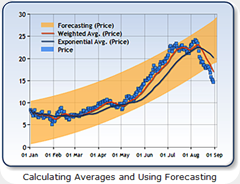
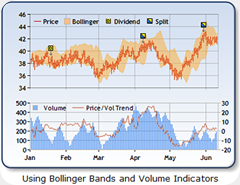
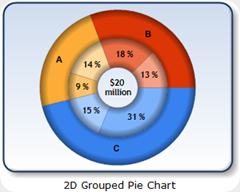
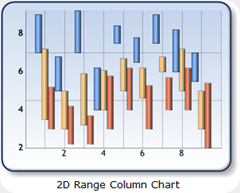
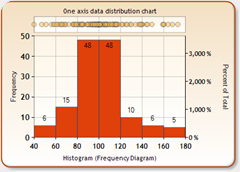
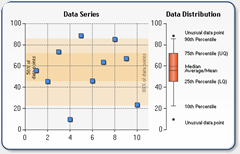
Below are a few samples of some of the more interesting things you can do. Currently a separate download for .NET v3.5, they will be included as part of .NET Framework 4.0.
Where do I get it?
Microsoft Chart Controls for Microsoft .NET Framework 3.5 Charts for both Web & also Windows Forms. Released 9 Aug 08
Microsoft Chart Controls Add-on for Microsoft Visual Studio 2008 Provides Intellisense & the Toolbox Designer. Released 16 Sep 08
Microsoft Chart Controls for .NET Framework Documentation Remember to read at least the first bit of this as it points you to some great samples on Codeplex & the support forum. Released 14 Oct 08
If English isn’t your language of choice, there are 28 Language Packs to choose from Microsoft Chart Controls for Microsoft .NET Framework 3.5 Language Pack (of course the English one I linked to is lame as everything is in english by default so it doesn’t have anything insightful. But it is the only language I can read :-(
Is that it?
-
- If you don’t already have it, you will need Microsoft .NET Framework 3.5 Service Pack 1
- Also good idea to update your copy of Visual Studio 2008 Microsoft Visual Studio 2008 Service Pack 1
- If you don’t have Visual Studio 2008, You can get the entry level versions here. Free versions of SQL Server, C++, C#, VB.NET & Web Developer
How do I get started?
- Download Samples Environment for Microsoft Chart Controls from codeplex. You will see an executable, WinFormsChartSamples.exe & a C# project that you creates it. Don’t waste your time looking for a VB.NET version. Just run the .EXE, it displays sample charts & the sample code you need to create that feature in both VB.NET & also C#.
- For help you can post questions on the Chart Controls for .NET Framework forums on MSDN
- Also a great read is Alex Gorev's Weblog Alex is the Microsoft Architect responsible for creating these controls. And has posted many useful tips.
- And if you are new to C# or VB.NET there are Tutorials & other free stuff here Get Started with Visual Studio
Is there anything else I should know?
I heard these charts were part of the code Microsoft purchased from Dundas in April 07. What are the differences? See Alex Gorev's Blog: Microsoft Chart Control vs. Dundas Chart Control
What if I need “More Power!!”
This release of the charts were derived from the codebase equivalent to Dundas Charts v5.5. MS & Dundas folk continue to evolve the code. Dundas release new versions quite frequently. Their version 6 has some cool new capability. Currently they are in Beta for Version 7, Check it out here Dundas Chart for .NET 7 Beta Now Available They also have some other nice components including one targeted at OLAP.
Before you ask, YES over time MS will incorporate the capability of the newer releases in our products. I have been impressed by, & enjoy, the speed that Dundas innovates & introduces new capability into their product line. So why doesn’t Microsoft release new products at that frequency? Many reasons but a major one is that very few people want us to. As a developer I’m happy to update to the latest release of a chart control every 3-4 months. But like many, I wouldn’t be keen on updating to a new release of Windows, Office, SQL Server or even Visual Studio at that frequency. The effort to upgrade those systems is much greater,especially if I want all my dev environments to be identical & remain stable throughout a project.
Is this the only architecture I could choose?
-
If you only need Charts in you Application or Web site – go with this or the Dundas equivalent.
Advantage: High-speed, interactive charts, tight integration with your apps UI.If you need to display both Charts and supporting Data consider using a Report. Either :-
A. Use the Reporting Services Report Viewer control that ships with Visual Studio 2005 & 2008. (FREE)
Advantage(s):
It can run in Local Mode (for disconnected experience) & Remote Mode (which lets you display reports generated by a SQL Reports Server.) This online/offline experience is done by changing the value of one property.
The local reports are rendered really fast within the context of your app, so you can get a very interactive feel.
Disadvantage:
VS2008 shipped before SQL 2008 was released. So, in Local Mode, this control does not have the improved charts, gauges, Rich Text, Tablix & other niceties provided by SQL 2008 Reporting services. It is capable of displaying the newer SQL 2008 Reports when switched to Remote mode.B. Use SQL Server 2008 Express with Advanced Services. (FREE)
This provides a copy of SQL 2008 Reporting Services to run on your machine.
Advantage:
Even when you aren’t connected to a network, your reports can access all the new features in SQL 2008.
Disadvantage:
The data sources for your report are limited to those on that machine, even if you are connected to a network. Of course you can use the Report Viewer to connect to this version too. If you upgrade to SQL Standard or Enterprise this limitation is removed, they can use any data source, located anywhere.
I hope this improves your productivity. Dave.
Technorati Tags: SQL Server 2008,FREE,.NET,Charts,SQL Server Reporting Services (SSRS)
