SQL 2008 Spatial Samples, Part 5 of 9 - Performance Improvement Methods
This post covers the following methods: Reduce, STEnvelope, EnvelopeCenter, EnvelopeAngle, STConvexHull.
Note: Unless otherwise stated. All code samples are designed to be Cut n Pasted directly into SQL Server Management Studio (SSMS) & run. Sometimes I've added extra detail than what is in the sample picture.
Overview of Performance Improvement methods.
If you collected all the spatial data that describes our world, it could easily fill exabytes. Having this very detailed information is useful when you need to zoom in. It may help to have every house on every street, every bend of every river etc. However when you zoom out it becomes a burden. Plotting thousands of points on one pixel, consumes bandwidth & other resources without providing any benefit.
Clearly there is a need to discard much of the detail. The challenge is to discard as much as you can without impacting the visual experience of the user.
Fortunately smart mathematicians have given this issue some thought. You can take advantage of their expertise by using SQL's .Reduce Method. It uses a variant of the Douglas-Peucker Algorithm.
The .Reduce method has 1 parameter, Tolerance. It must be a positive floating point number. Any details smaller than this number will probably be removed. The tricky part is knowing what value to set that parameter to. The rest of this post is dedicated to that question.
Algorithm Summary:
- Determine the resolution of your display window (in pixels)
- Determine the scale of what you are displaying.
- Divide (2) from (1) to find the scale of each pixel.
- That gives you a ballpark number for what you will reduce by.
Unfortunately it is not an exact science, perhaps any detail smaller than 10 - 20 pixels you will remove. Maybe a cutoff of 100 or 1,000 pixels will work better for you. It depends on the resolution (pixels/inch) of your display & a subjective opinion of your User as to what looks "cluttered" to them. Often you will use this to control the extremes & then give the User a way to configure their preference.
It is also worth considering pre-processing your data & storing it as different "Zoom" levels. eg: Zoom Level 1 could represent 10,000kms & show country borders. thru to Zoom Level 'n' which may contain details of land parcels together with easement restrictions & building outlines. Clearly at that level you would be able to filter to a few 100 rows & not attempt to draw 5 million homes at once.
Method .Reduce()
- Reduces the number of points in a Spatial Object.
- If it converts a polygon or a line into a single point you can often ignore the row. Resulting in a reduction of rows returned.
- Works with both Geometry & Geography objects
Syntax: geo1.Reduce(tolerance)
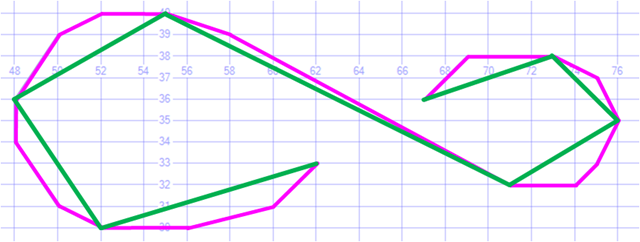
 -- ==< Sample: Code calling the .Reduce() Method >==
DECLARE @h AS GEOMETRY
SET @h = GEOMETRY::STGeomFromText('LINESTRING(67 36,68 37,69 38,73 38, 75 37,76 35,
                                   75 33,74 32,71 32,69 33,58 39,55 40,52 40,50 39,
                                   48 36,48 34,50 31,52 30,56 30,60 31,62 33)', 0);

SELECT @h as 'Geo', 'Line' AS 'Labels',@h.STAsText() as 'Text'
UNION ALL
SELECT @h.Reduce(2), 'Reduce(2)' AS 'Labels',@h.Reduce(2).STAsText() as 'Text'
Sample Output:
Purple is the original line consisting of 19 points.
Green is the line produced with .Reduce(2). It is no more than 2 units away from the original line, now 8 points.
Method .STEnvelope()
- Find the minimum rectangle that fits around this geometry object.
- USE:
- Handy to centre the object within a display window.
- Combine with .Reduce to optimise the display & save IO, CPU & Network
- Works with Geometry objects only. It is not a method of Geography Objects.
- Geography equivalent is EnvelopeAngle() & EnvelopeCenter()
Syntax: myGeometry.STEnvelope()
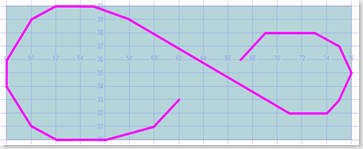
 -- ==< Sample: Code displaying using STEnvelope for create a bounding box >==
DECLARE @b AS GEOMETRY
SET @b = GEOMETRY::STGeomFromText('LINESTRING(67 36,68 37,69 38,73 38,75 37,76 35,
                                   75 33,74 32,71 32,69 33,58 39,55 40,52 40,50 39,
                                   48 36,48 34,50 31,52 30,56 30,60 31,62 33)', 0);

SELECT @b as 'Geo', 'Line' AS 'Labels',@b.STAsText() as 'Text'
UNION ALL
SELECT @b.STEnvelope(), 'STEnvelope()', @b.STEnvelope().STAsText()
Purple is the original line.
Blue is the minimum rectangle that fits around this line.
Method .EnvelopeCenter() & .EnvelopeAngle()
- Find the bounding circle that fits around this geography object.
- Why a circle? Imagine slicing thru a sphere with a knife. You always get a circle.
- Books Online says: “not guaranteed to produce the minimal bounding circle”. I agree, I've never seen it produce the absolute minimum circle. While it is much better than nothing, the lack of precision does limit how useful it really is. Working with a circle is challenging enough, the "not minimal" aspect means that your errors compound. By the time you've Unioned the envelope of a few thousand shapes, your result may be many times bigger than the perfect minimum.
- Warning:
Latitude must be within -90 & +90. Given that Bounding Circle might be bigger than the shape, the unfortunate side-effect is you can attempt to create bounding circles which are larger than 90 degrees. Resulting in a .NET error.
Similarly if your data only just fits inside a single hemisphere, the bounding circle may exceed it, resulting in the error below.
Msg 6522, Level 16, State 1, Line 22
A .NET Framework error occurred during execution of user-defined routine or aggregate "geography":
Microsoft.SqlServer.Types.GLArgumentException: 24205: The specified input does not represent a valid geography instance because it exceeds a single hemisphere. Each geography instance must fit inside a single hemisphere. A common reason for this error is that a polygon has the wrong ring orientation.
- You can think of EnvelopeAngle as a distance. Your distance is measuring "Degrees of Longitude" or "Degrees of Latitude" so it is an Angle & not a linear measurement. It is the Radius of the bounding circle.
- Use:
- EnvelopeCenter is handy to centre the object within a display window.
- Combine with .Reduce to optimise the display & save IO, CPU & Network
- Works with Geography objects only. It is not a method of Geometry Objects.
- EnvelopeCenter is similar to geometry method STCentroid()
Syntax: myGeometry.EnvelopeCenter()
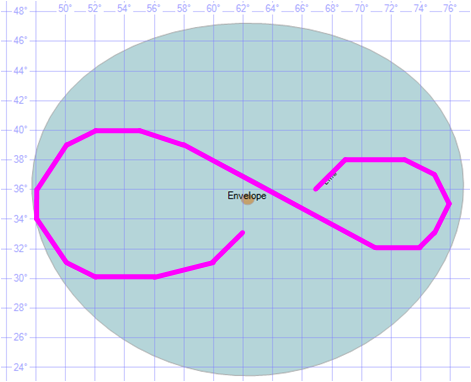
 -- ==< Sample 1: Show use of Geography Envelope methods. >==
DECLARE @g AS GEOGRAPHY
SET @g = GEOGRAPHY::STGeomFromText('LINESTRING(67 36,68 37,69 38,73 38,75 37,76 35,
                                    75 33,74 32,71 32,69 33,58 39,55 40,52 40,50 39,
                                    48 36,48 34,50 31,52 30,56 30,60 31,62 33)', 4236);

SELECT @g as 'Geo', 'Line' AS 'Labels',@g.STAsText() as 'WKT'
UNION ALL
-- Expand the centre point to show its not quite centred
SELECT @g.EnvelopeCenter().STBuffer(1319650), 'Envelope Bounding Circle',  @g.EnvelopeCenter().ToString()
UNION ALL
SELECT @g.EnvelopeCenter().STBuffer(40000), 'EnvelopeCenter',  @g.EnvelopeCenter().ToString()

-- This value can be added or subtracted from EnvelopeCenter().Long to get Min & Max X
SELECT @g.EnvelopeAngle() As EnvelopeAngle
go
Purple is the original line.
Blue is the bounding circle created for this line.
Another example : Showing the bounding circle
This sample shows how you can use EnvelopeAngle to create a buffer to show what is covered by the BoundingCircle. You will discover that :-
a) EnvelopeCentre is biased to where most of the points are located.
b) But the EnvelopeAngle is dramatically affected by outlier points.This is good & bad. It means that centring your display window on the EnvelopeCentre will mean that you are likely to show most of your information. But using the EnvelopeAngle to calculate the .Reduce Value can mean you are way off. To get the minimum bounding circle you would want the EnvelopeCentre to be the geometric centre of all the outlier points, which it is not.
Try adding new points outlier points to the Polygon in the example below to see how it works.-
 -- ===< Sample 2: Show relationship between EnvelopeCentre & EnvelopeAngle >==
DECLARE @Buffer INT
DECLARE @g AS GEOGRAPHY;
SET @g = 'POLYGON( (1 1, 2 1, 5 3, 7 6, 5 9, 2 11, 1 11, 5 6, 1 1))'

-- -- Create a line that is the Radius
DECLARE @Radius AS GEOGRAPHY = GEOGRAPHY::STGeomFromText('LINESTRING ('
   + CONVERT(varchar(10),@g.EnvelopeCenter().Long )  + ' '
   + CONVERT(varchar(10),@g.EnvelopeCenter().Lat ) + ','
   + CONVERT(varchar(10),@g.EnvelopeCenter().Long + @g.EnvelopeAngle())  + ' '
   + CONVERT(varchar(10),@g.EnvelopeCenter().Lat ) + ')',4326);

SELECT @Radius.STLength() as [STLength (meters)] , 2 * @g.EnvelopeAngle() as [2 * EnvelopeAngle()]
SELECT @Buffer = @Radius.STLength()

-- --< Show relationship between objects in SSMS's Spatial results tab >--
SELECT @g.EnvelopeCenter().STBuffer(@Buffer) as geo, @g.EnvelopeCenter().STBuffer(@Buffer).ToString() as WKT, '.EnvelopeCircle' as Method
UNION ALL
SELECT @g, @g.ToString(), 'Exterior of Shape'
UNION ALL
SELECT @g.EnvelopeCenter().STBuffer(20000), @g.EnvelopeCenter().ToString(), '.EnvelopeCenter'
Another example : Creating a bounding rectangle around the bounding circle
You may find this handy when drawing your data, especially if you use a matrix transformation to plot them on the screen. But be careful as it is really common to have the envelope "explode" over more than a half hemisphere & result in an error. To avoid that issue instead of a SQLGeography Type try using a GDI+ Rectangle object or similar code object.
-
 -- ===< Sample 3: Show relationship between EnvelopeCentre & EnvelopeAngle >==

DECLARE @g AS GEOGRAPHY;
SET @g = 'POLYGON( (1 1, 2 1, 5 3, 7 6, 5 9, 2 11, 1 11, 5 6, 1 1))'

-- --< How to create a Minimal Bounding Box using EnvelopeCentre & EnvelopeAngle >===
-- Check you don't exceed +/-90 deg Latitude
DECLARE @Top FLOAT
DECLARE @Bot FLOAT
SET @Top = CASE WHEN @g.EnvelopeCenter().Lat + @g.EnvelopeAngle() >  90
                THEN  90 ELSE (@g.EnvelopeCenter().Lat + @g.EnvelopeAngle()) END

SET @Bot = CASE WHEN @g.EnvelopeCenter().Lat - @g.EnvelopeAngle() < -90
                THEN -90 ELSE (@g.EnvelopeCenter().Lat - @g.EnvelopeAngle()) END

-- Create minimum Rectangle Bounding Box
DECLARE @Env AS GEOGRAPHY = GEOGRAPHY::STGeomFromText('POLYGON (('
   + CONVERT(varchar(10),@g.EnvelopeCenter().Long - @g.EnvelopeAngle())  + ' ' + CONVERT(varchar(10),@Bot) + ','  -- Lower Left
   + CONVERT(varchar(10),@g.EnvelopeCenter().Long + @g.EnvelopeAngle())  + ' ' + CONVERT(varchar(10),@Bot) + ','
   + CONVERT(varchar(10),@g.EnvelopeCenter().Long + @g.EnvelopeAngle())  + ' ' + CONVERT(varchar(10),@Top) + ','  -- Upper Right
   + CONVERT(varchar(10),@g.EnvelopeCenter().Long - @g.EnvelopeAngle())  + ' ' + CONVERT(varchar(10),@Top) + ','
   + CONVERT(varchar(10),@g.EnvelopeCenter().Long - @g.EnvelopeAngle())  + ' ' + CONVERT(varchar(10),@Bot) + '))',4326);

-- --< Show relationship between objects in SSMS's Spatial results tab >--
SELECT @Env as Geog,  @Env.EnvelopeCenter().ToString() as WKT, 'Envelope on Circle' as Method
UNION ALL
SELECT @g.EnvelopeCenter().STBuffer(620000), @g.EnvelopeCenter().STBuffer(620000).ToString(), '.EnvelopeCircle'
UNION ALL
SELECT @g , @g.ToString() , 'Exterior of Shape'
UNION ALL
SELECT @g.EnvelopeCenter().STBuffer(20000), @g.EnvelopeCenter().ToString(), '.EnvelopeCenter'

-- --< Creating a Line is easier to calculate the actual distance across your Envelope >--
-- -- Create a line from Lower Left to Top Right
DECLARE @Line1 AS GEOGRAPHY = GEOGRAPHY::STGeomFromText('LINESTRING ('
   + CONVERT(varchar(10),@g.EnvelopeCenter().Long - @g.EnvelopeAngle())  + ' '
   + CONVERT(varchar(10),@Bot) + ','
   + CONVERT(varchar(10),@g.EnvelopeCenter().Long + @g.EnvelopeAngle())  + ' '
   + CONVERT(varchar(10),@Top) + ')',4326);

SELECT @Line1.STLength() as [STLength (meters)] , 2 * @g.EnvelopeAngle() as [2 * EnvelopeAngle()]
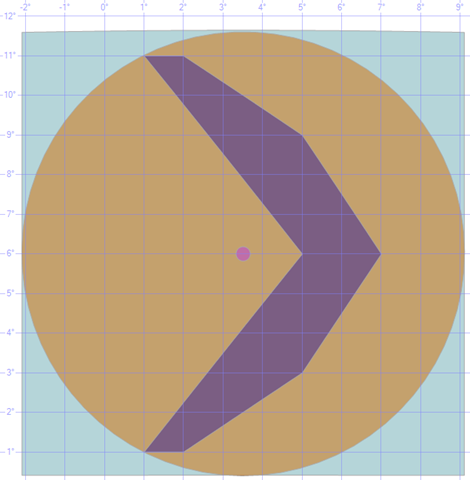
This diagram shows :-a) The original shape (purple).
b) The EnvelopeCentre (pink dot). I put a 20km circle around it so you could see it.
c) Drawing a 620km circle around the Centre shows the Bounding Circle (brown). In this projection if the centre was a little more to the right, it would be possible to draw a smaller circle around this shape. But remember shape is actually on a sphere & what you are seeing is a flattened representation of that.
d) The Bounding box (Blue Square) is formed by adding/Subtracting the EnvelopeAngle to the EnvelopeCentre. Unfortunately it is the Envelope around the bounding circle & not around the Shape itself.
Method .STConvexHull()
- Find the smallest bounding shape that completely encloses this object.
- Works with Geometry objects only. It is not a method of Geography Objects.
- Uses
- Handy when repainting an invalid area of the screen if you animate or zoom this shape.
- Good for finding points contained within this general path.
- Great for creating areas when paths (linestrings) aren’t closed properly.
- Excellent for converting points into Polygons. Especially groups of 3 point to create a mesh of little triangles you can Union together.
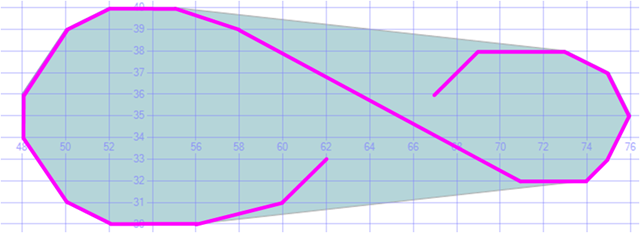
 -- ==< Sample code displaying using STConvexHull() to create a minimal perimeter >==
DECLARE @b AS GEOMETRY = geometry::STGeomFromText('LINESTRING(67 36,68 37,69 38,73 38,75 37,76 35,75 33,74 32,
                            71 32,69 33,58 39,55 40,52 40,50 39,48 36,48 34,50 31,52 30,56 30,60 31,62 33)', 0);

SELECT @b as 'Geo', 'Line' AS 'Labels',@b.STAsText() as 'Text'
UNION ALL
SELECT @b.STConvexHull(), 'STConvexHull()', @b.STConvexHull().STAsText()
Purple is the original line. Blue is the minimum shape that fits around this line which has no concave areas.
Part B: Using .Reduce
Below is a sample of putting the .Reduce method in your code. Often it is best to combine it with other filters.
SELECT [ID], ....
,[GEO].Reduce(5000)
,[GEO].STLength() as 'Length'
,[GEO].Reduce(5000).STLength() as 'STLength'
FROM [GIS_Australia].[dbo].[coastl]
WHERE [GEO].Reduce(5000).STLength() > 0
AND ... < intersects my display area >
AND ... < other filter criteria >
How do you calculate the minimum window around all your shapes?
For Geometry
There are 4 alternatives I've considered so far. If you are in a hurry, just look at Option 3. It is typically twice as fast as Option 2, and 100 to 1,000 times faster than Option 1. I've only included the cursor based approaches as you may see them in other posts & wonder which is best. In the past 2 decades I'm been programming TSQL I've only found 2 queries that ran faster as a cursor than they did as Set Based queries. (and both a long time ago, on versions prior to SQL 2000). So as a rule if you can rewrite a query as a set based operation you get much better performance.
Notes on different options: Option 4 seems to deliver the same performance as Option 3. It is much easier to use. But means that you will need to register the CLR function in every database you use it on. As these routines were developed by members of the SQL Spatial Team it is a fair bet they will make their way into a future release of SQL Server.
Notes on Cursors:
- The cursor option "FAST_FORWARD" is the most efficient for this type of use; Read-Only, Read start to finish.
- Do not use the "With NOLOCK" hint, PageSplits may hurt you. (unless your testing shows it necessary & you understand what you are doing.)
- Instead, For spatial reference data, (roads, suburb boundaries, etc), Try putting the spatial table on a READONLY Filegroup. This too means no locks are taken & also reduces the size of your nightly backups.
Option 1. Cursor Based approach: Envelope around the Union of Shapes.
Summary: Really CPU heavy & really slow for Reduce calculation.
But handy if you want to create a total union of a set of shapes.Step 1: Loop thru each shape, use STUnion to create a total shape outline.
Step 2: Use Envelope methods to find the minimum bounding box around the total shape.
Step 3: Find the ratio between the Display Window & the Envelope
 -- ==< Option 1. Cursor Approach to Calculating a Envelope of Total Shapes >==
DECLARE @thisGeom geometry;
DECLARE @totalGeom geometry;
DECLARE @firstRow INT = 1 -- Used as BOOLEAN = TRUE

-- < Calculate a Total Shape >--
DECLARE GeomCursor CURSOR FAST_FORWARD FOR SELECT [geom] FROM [GIS_NorthShore].[dbo].[NSW_Suburbs_region]; -- WITH (NOLOCK);
OPEN GeomCursor;
FETCH NEXT FROM GeomCursor INTO @thisGeom;
WHILE @@FETCH_STATUS = 0
    BEGIN
        IF (@firstRow = 1) BEGIN -- First Row Returned
            SET @totalGeom = @thisGeom;
            SET @firstRow = 0; -- FALSE
        END;
        ELSE BEGIN
            SET @totalGeom = ( SELECT @totalGeom.STUnion(@thisGeom));
        END;
        FETCH NEXT FROM GeomCursor INTO @thisGeom;
    END;
CLOSE GeomCursor;
DEALLOCATE GeomCursor;
-- SELECT @totalGeom as [Total Shape] -- Use this if you really need the total shape

-- < Get the Envelope of the Total Shape >--
SELECT @totalGeom = @totalGeom.STEnvelope()
SELECT @totalGeom.STPointN(1).STX AS [Left], @totalGeom.STPointN(1).STY AS [Bottom], @totalGeom.STPointN(3).STX AS [Right],  @totalGeom.STPointN(3).STY AS [Top];
go
Option 2. Cursor Based approach: Union of all the Envelopes of Shapes.
- Summary: Much improved, but cursor causes internal overhead.
Step 1: Loop thru each shape, Use Envelope methods to find its minimum bounding box
Step 2: Use STUnion to create a total outline of all the shape envelopes.
Step 3: Find the ratio between the Display Window & the Total Envelope
 -- ==< Option 2. Cursor Approach to Calculating Total of Shapes Envelopes >==
DECLARE @thisGeom geometry;
DECLARE @totalGeom geometry;
DECLARE @firstRow INT = 1 -- Used as BOOLEAN = TRUE

DECLARE GeomCursor CURSOR FAST_FORWARD FOR SELECT [geom] FROM [GIS_NorthShore].[dbo].[NSW_Suburbs_region]; -- WITH (NOLOCK);
OPEN GeomCursor;
FETCH NEXT FROM GeomCursor INTO @thisGeom;
WHILE @@FETCH_STATUS = 0
    BEGIN
        IF (@firstRow = 1) BEGIN -- First Row Returned
            SET @totalGeom = @thisGeom;
            SET @firstRow = 0; -- FALSE
        END;
        ELSE BEGIN
            SET @totalGeom = ( SELECT @totalGeom.STUnion(@thisGeom).STEnvelope()); -- NB: Envelope of Shape
        END;
        FETCH NEXT FROM GeomCursor INTO @thisGeom;
    END;
CLOSE GeomCursor;
DEALLOCATE GeomCursor;

-- < Return Envelope >--
SELECT @totalGeom.STPointN(1).STX AS [Left],  @totalGeom.STPointN(1).STY AS [Bottom]
      ,@totalGeom.STPointN(3).STX AS [Right], @totalGeom.STPointN(3).STY AS [Top];
go
Option 3. Set Based approach: Find the extreme edges of the Shape Envelopes.
Summary: Best approach found so far.
Step 1: Use Envelope methods to find its minimum bounding box of each row.
Step 2: Return the Left, Lowest, Right & Topmost points of each shape envelope.
Step 3: Use TSQL Aggregate functions to return the Min of Left & Lowest, and the Max of Right & Top.
Step 4: Use the coordinates to create an Envelope (or just a line you can get the Distance from)
Step 5: Find the ratio between the Display Window & the Total Envelope.
 -- ===< Option 3: Efficient way to calculate the Minimum Bounding Box of a large set of Geometric Objects >===
DECLARE @Left FLOAT
DECLARE @Lower FLOAT
DECLARE @Right FLOAT
DECLARE @Top FLOAT

SELECT  @Left = MIN([geom].STEnvelope().STPointN(1).STX)
       ,@Lower = MIN([geom].STEnvelope().STPointN(1).STY)
       ,@Right = MAX([geom].STEnvelope().STPointN(3).STX)
       ,@Top = MAX([geom].STEnvelope().STPointN(3).STY)
FROM [GIS_NorthShore].[dbo].[NSW_Suburbs_region]

-- --- Either Calculate the diagonal distance across the Bounding box. ---
DECLARE @Diagonal GEOMETRY
SET @Diagonal = GEOMETRY::STGeomFromText('LINESTRING ('
            + CONVERT(varchar(10),@Left)  + ' ' + CONVERT(varchar(10),@Lower) + ','
            + CONVERT(varchar(10),@Right)  + ' ' + CONVERT(varchar(10),@Top) + ')',4326);
SELECT @Diagonal as Diagonal, @Diagonal.STLength() as Length, @Diagonal.ToString() as WKT
       ,@Left as [Left], @Lower as [Lower], @Right as [Right], @Top as [Top]

-- --- Or Return an Envelope. ---
SELECT @Diagonal.STEnvelope() as Envelope
Option 4. CLR Based approach: Use Extension provided by SQL team members.
Summary: Easiest to use, but requires extra install steps.
Step 1: Download extra functionality from Codeplex: SQL Server Spatial Tools
Step 2: Install it on any Database you which to use it on.
 -- ===< Option 4: Use the specific CLR function from Codeplex: SQL Server Spatial Tools >===
SELECT dbo.GeometryEnvelopeAggregate(geom)
FROM dbo.NSW_Suburbs_region
For Geography
I'd like to tell you I have this one totally thought thru, but I don't. The potential that the bounding circle(s) will exceed the object, & blow out past +/-90 deg Latitude, causes me to be concerned about most approaches derived from EnvelopeCentre & EnvelopeAngle. Yes, this can be solved with an IF statement & only likely to effect those interested in areas near the poles. We still have the issue of compounded errors creating a much larger error, which confuses our .Reduce variable.
Option 1: Convert all geography elements to Geometry & use the geometry options above.
I've copied a snippet of the code below from Johannes Kebeck's Blog - Virtual Earth & SQL Server 2008: Better Together just to show you how to convert from Geography to/from Geometry. Once converted to Geometry you could use the approaches above. I'm a little nervous about this approach as swapping back & forth may introduce translation errors. Note: This idea is very different use to the point Johannes is making. He is converting Geometry to Geography to get more accurate real world distance calculations, that idea should work fine.
 --Determine max and min Latitude
SELECT @BBOX.STPointN(1).STY AS [Min Latitude];
SELECT @BBOX.STPointN(3).STY AS [Max Latitude];

--Create GEOGRAPHY from GEOMETRY to calculate distances in meters
DECLARE @BBOX_GEOG geography;
SET @BBOX_GEOG = (geography::STGeomFromWKB(@BBOX.STAsBinary(), 4326));

--Calculate Distance
SELECT ROUND(@BBOX_GEOG.STPointN(1).STDistance(@BBOX_GEOG.STPointN(2)),2) AS [X-Dist at Min-Lat];
SELECT ROUND(@BBOX_GEOG.STPointN(3).STDistance(@BBOX_GEOG.STPointN(4)),2) AS [X-Dist at Max-Lat];
SELECT ROUND(@BBOX_GEOG.STPointN(2).STDistance(@BBOX_GEOG.STPointN(3)),2) AS [Y-Dist];
Option 2. Use Spatial Tools to Convert all geography elements to Geometry & use the geometry options above.
Similar to Option 1 except you use the Spatial Tools from from Codeplex: SQL Server Spatial Tools to do the work.
You can convert from Geometry to Geography using VacuousGeometryToGeography() then use GeometryEnvelopeAggregate(geom ) as we did in geometry Option 4 above.
Option 3. Use the Codeplex Spatial Tools methods, to create an aggregate shape.
Step 1. Create a Total Shape using spatial tools GeographyUnionAggregate method.
 SELECT dbo.GeographyUnionAggregate(geog,1)
FROM dbo.Suburbs_Geog_Region
Step 2. Then use EnvelopeCentre & EnvelopeAngle as described earlier in this post.
Option 4: Run thru all points in all shapes & store Min(Lower Left), Max(Top Right). Then use Geometry Option 3 above.
Summary: This has the potential to be much faster than other approaches. But means some kind of preprocessing or CLR function (which has potential to be heavy on CPU)
Step 1. Create 4 new columns in your "Shapes" table; Left, Right, Top, Bottom.
Step 2. Using a Trigger, Batch Job or your CLR function, scan thru all points in the geography shape & extract the leftmost point, the topmost point, etc & store them in this row.
Step 3. Use query similar to Geometry Option 3 above to find Min & Max values of the ResultSet. Build your Envelope from there.
Summary
All the above assumes you are retrieving rows based on some criteria, eg: High Crime Areas, & attempting to centre that information in a display. If you are coming from the other direction, eg: the user drew a rectangle on a map & wanted to Zoom In on that area. That is a much easier problem to solve. Just use the size of the rectangle to calculate your "Reduce" value. Also use the STIntersects method to retrieve the relevant spatial data.
Final Thoughts - Stating the Obvious.
.Reduce is a powerful method for reducing the rendering overhead of your application. But its power comes at a cost, it does require CPU cycles on the server. If you call it twice for each row (once to select & again in the where clause to discard 0 length rows) it could take longer to execute your queries. (still might be faster to render)
There are other ways that are more effective in reducing the number of rows your query returns. DON'T FORGET THE WHERE CLAUSE. Use a rectangle to only retrieve the rows you want to display. Then consider using Reduce on that result set.
-- ==< Sample: Using WHERE filter to only return shapes you want to display >==
DECLARE@DisplayWindow AS GEOMETRY=
'POLYGON((151.2 -33.9, 151.3 -33.9, 151.3 -33.7, 151.2 -33.7, 151.2 -33.9))'
SELECT ID,GEOM
FROM dbo.NSW_Suburbs_region
WHERE geom.STIntersects(@DisplayWindow) =1
-- Sorry: this sample can't just be pasted into SSMS as it requires a table you don't have
More info
For more info see SQL Server 2008 Books Online Extended Methods on Geography Instances
Please give feedback. Is this series of articles useful? Did it save you time? What was good, What could be better?, Notice any errors? What would you like me to cover? All thoughts, comments, suggestions welcome.
Technorati Tags: SQL Server Spatial,Spatial,TSQL,.NET