Expression Media Survey Results

Two weeks ago I opened a survey to learn more about iView and Expression Media customers, who use the product primarily for managing photos. Since a number of you took the time to offer the requested feedback, I wanted to share with you some of the survey results.
First, a note about my methodology and reasoning.
1. To get it in front of as many people as possible, I posted survey links on the various product forums (old iView forum, old Microsoft newsgroup, new Microsoft forum) and Peter Krogh's forum. As a result, the only people who ever saw the survey request at least browse the forums, so that's not going to be every customer.
2. I caught some flak from customers and colleagues alike for making the survey so open-ended. I also got praise for the same reason :) Here's why I went the open-ended route: I don't know what I don't know. If I give people a list of possible responses, I'll end up with a massive laundry list of features and still miss someone's favourite. For instance, one respondent called out as one of their favourite/most important features the ability to generate XML datafiles. That one probably wouldn't have made it on my pick-list of choices had I gone for a multiple choice answer format. I also wanted to allow people to express themselves in a way that multiple choice just doesn't allow. I know I lost people when they saw the survey format (the survey software tells me where respondents dropped off), but I accept that reality. Open ended-answers certainly make parsing the responses harder and I regard the open-ended stuff as purely qualitative, but that's fine - it is what I was looking for.
3. The sample size isn't that big. It is also self-selected. All bad statistical things. That's OK too. This was an initial attempt at reaching out. So when interpreting the results, I don't think "all IVMP/xMedia customers are like this" and we're not going to be making decisions solely based on this data.
4. The survey was also an opportunity to create a "customer panel." That's a scary term and might have put some people off. It is very informal. From time to time, we're going to want to ask people things, get them to try stuff out, hit them up for ideas and maybe, just maybe, ask them if they'd like to say something nice about the product that we can use for marketing purposes (if they say something bad, I just send it to the dev team, and they turn up in black helicopters ;) ) If you want to be part of the customer panel, hit the email link at the top of the blog.
And now for the results...
Well not quite. A word about the big pie chart. The challenge for the survey taker with open-ended questions is parsing the responses. I created some top level categories that make sense when thinking about the product such as: organizing, cataloging, finding, publishing, etc. I then used my judgement to put the responses into these categories. Not hugely scientific, but again this part is qualitative (even though it has percentages on the chart... oops!)
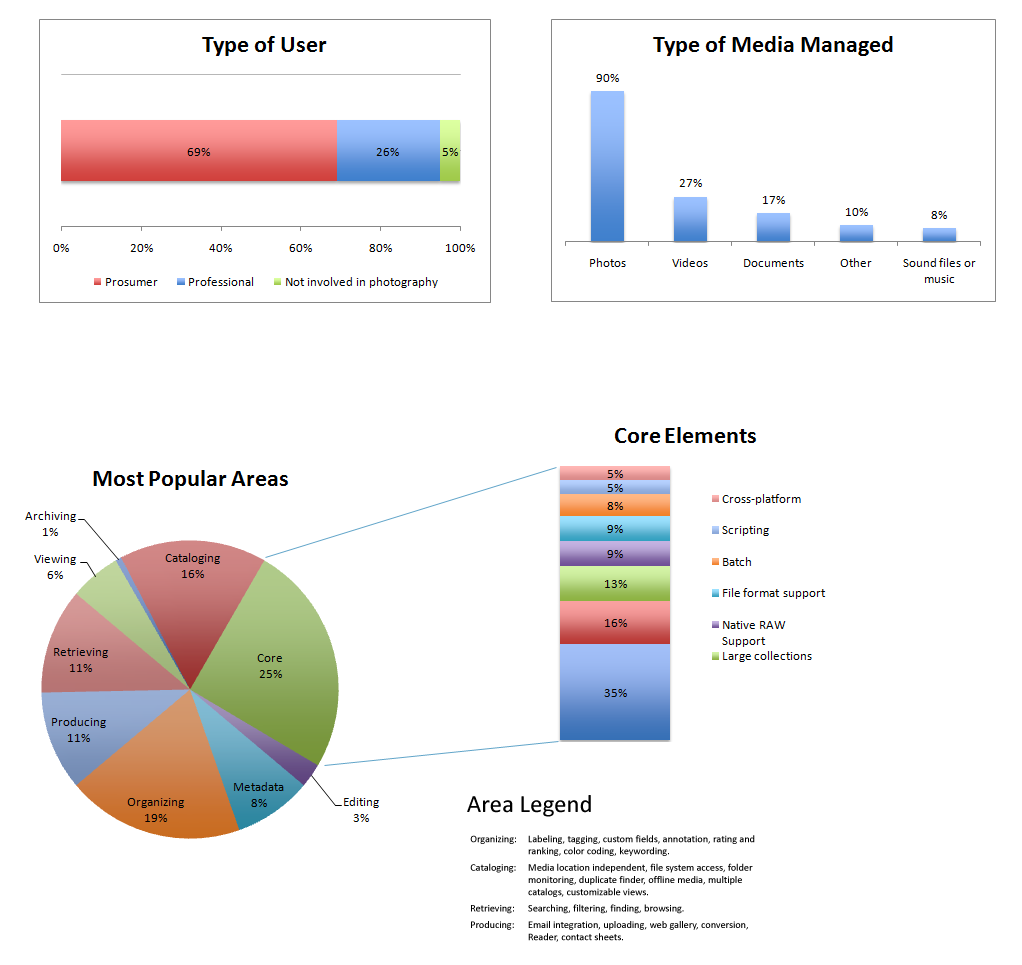
[Click on the picture to make it bigger]
Some more notes on the chart.
Under type of user, professional refers to someone who derives their primary income from photography. A prosumer might look like a pro, sound like a pro, walk like a pro, etc. but is gainfully employed doing something else. This was a mutually exclusive answer - you couldn't be a pro and a prosumer, obviously.
Type of media managed could have multiple responses, so you could manage photos, videos and documents.
Going back to the pie chart, there's this core catch all category. This captures features or attributes that are intrinsic to the architecture of the product. The other thing to call out in the pie chart is the metadata area. The product is fundamentally all about metadata. When you organize, catalog or find, you're using metadata whether you know it or not. So the metadata area captures "advanced uses" of metadata rather than metadata use as part of normal operations.
Finally, I hope that you find the results interesting. I'm going out on a bit of limb publishing this. Survey results are typically held close to the chest, but I want to be transparent about what we're doing. So expect to see more behind the scenes stuff here. If you don't want to know what goes into the sausage, look away :)