Hidden treasures in WinDbg -> Save CLRProfiler-compatible files from memory dumps
Last week I discovered a feature in WinDbgs SOS extensions.. you know the one that extends the debugger with managed code features.
I received a memory dump from a customer and was asked to analyze the reason for the hang. It was pretty obvious that the process under investigation was suffering from a managed memory issue that is referred to as large object heap fragmentation (LOHF). Reason for this problem is caused by frequently consuming and recycling managed objects larger than 85.000 bytes because such objects are stored in the large object heap - a managed heap region that never gets compacted and thus tends to suffer from fragmentation side-effects.
Check the MSDN Magazine Article for further reading...
Figuring that out is only have of the support story. When stopping at a garage you don't just want to be told that your car isn't ok. The more important step is to figure out the reason for it and derive a work-around or a fix from such information.
When analyzing managed memory dumps with WinDbg I often whished to visualize the heap allocation. Personally I don't like the output of !GCRoot as I get confused by that many lines. One tool that allows visualizing heaps from a bird-view perspective is CLRProfiler.
CLRProfiler does not understand memory dumps but WinDbgs SOS extension allows to export a profiler-compatible file format out of dumps:
!TraverseHeap [-xml] <filename>
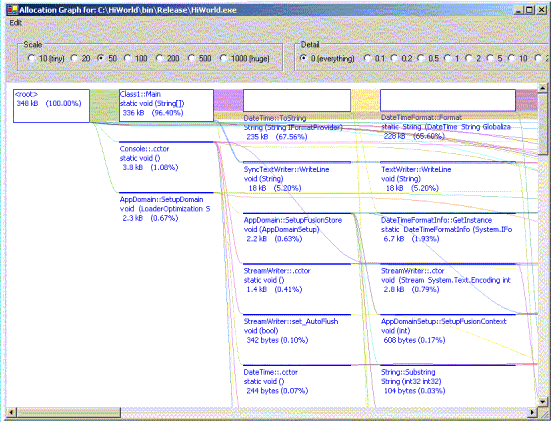
As a result you'll be given a visual tree representation of the relationships of your objects in managed memory:
Give it a try and have fun (save time) with it...
Let me know if you are interested in more details regarding managed memory debugging scenarios!
