Using Data Explorer and Geoflow to decide where to go for dinner!
Data Explorer and Geoflow are the new additions to the Self-Service BI tools in Excel. But as you will see in this post, Self-Service BI can become truly personal depending on the nature of the questions that you are trying to answer…
This got demonstrated yesterday in a blog post on the Microsoft BI blog: Surfing Restaurant Inspections with Microsoft Data Explorer and Geoflow
==========================================================================================
Father’s Day is approaching and you might be thinking about a good place to have a nice lunch with your Dad… We would like to show you how Data Explorer and Geoflow can help you gather some insights to make a good decision.
In order to achieve this, we will look at publicly available data about Food Establishment Inspections for the past 7 years and we will also leverage the Yelp API to bring ratings and reviews for restaurants. For the purpose of this post, we will focus on the King County area (WA) but you can try to find local data about Food Establishment inspections for your area too.
What you will need:
- Data Explorer.
- Geoflow.
- Access to the following data:
- Food Establishment Inspections data from datakc.org (more details):
-
- We will link to this URL (which points to the CSV file version of the data) using Data Explorer: https://www.datakc.org/api/views/pph9-v8tz/rows.csv?accessType=DOWNLOAD
- Yelp API (more details):
-
- You will need to sign up for an API key before being able to connect. Please also make sure to read the Yelp API Terms of Use before using this API.
What you will learn in this post:
- Import data from the Yelp Web API (JSON) using Data Explorer.
- Import public data about Food Establishment Inspections from a CSV file.
- Reshape the data in your queries.
- Parameterize the Yelp query by turning it into a function, using the Data Explorer formula language, so you can reuse it to retrieve information about different types of restaurants as well as different geographical locations.
- Invoke a function given a set of user-defined inputs in an Excel table.
- Combine (Merge) two queries.
- Load the final query into the Data Model.
- Visualize the results in Geoflow.
That sounds like too much for a single blog post, but let’s get started and you’ll see how it is easier than you might think.
Import data from Yelp API
The first thing that we will have to do is click the “From Web” button in the Data Explorer ribbon tab. Data Explorer supports importing data from different kinds of Web sources, including scrapping tables from HTML pages, as well as importing data from Web APIs. Data Explorer supports XML, JSON and OData formats.

Taking a look at the Yelp API documentation, you will find that they offer a Search API which accepts multiple GET parameters to customize your query, including a search term (i.e. restaurants, sushi, seafood, etc.), a location (i.e. “Seattle”, “98052”, lat/long information) and a few others. Finally we also need to provide the API Key that we will receive after registering for this API (wsid parameter).
With that in mind, let’s paste in Data Explorer the following URL which will return Seafood restaurants in Redmond (note that you will have to replace the wsid value with your own key).
https://api.yelp.com/business\_review\_search?term=seafood\&location=Redmond &ywsid=XXXXXX
We will get a result that looks like a single column table with one row, containing text data which, in fact, is structured as JSON. We can interpret this text as JSON by right-clicking in the column header and selecting “Transform -> JSON”.

Now as a result we get a record which we can expand and select which fields to include in the output. Having used the Yelp API before, we know that the “businesses” field is the one that contains the list of restaurants that we are looking for, so we can just expand that one by unselecting “message” in the Expand menu and clicking “OK”.

This will return a single cell containing a list, which we can expand using the same mechanism again and turn it into a bunch of records, one per restaurant. Now we can decide which columns to expand, containing different information about each restaurant such as Name, Lat/Long information, Rating, etc. We will expand the following columns: city, review_count, latitude, address1, name, avg_rating and longitude.
Now we have the list of Seafood restaurants into a tabular shape, and after applying some column renames and reordering the columns, we can get to the following shape.

That was actually easy… At the end, all we’ve done is define a set of data acquisition and transformation steps, which get recorded in the Steps pane on the right side of the Query Editor dialog. This Query Editor dialog is an easy-to-use interface for defining these steps, which get translated into the corresponding set of Data Explorer formulas (you can access them by clicking the script icon to the right end of the formula bar).

Parameterizing our Yelp API query
As we saw in the previous section, we can customize our Yelp Search by modifying the GET parameters in the URL. We can also make our Data Explorer query parameterized by turning it into a function, which can take input parameters and use them within the function body. In order to do this, we just need to add the following first line to our query script and use the parameters in the first step (Source). Finally, we can also rename our query to GetRestaurants.

This was very straightforward, but if you want to learn more about Data Explorer functions you can take a look at the Language and Library Specifications. There’s more cool stuff waiting for you there!
Invoking the GetRestaurants function
Now that we have a function, it would be a good thing to learn how to invoke it… There’re basically three ways in which you can invoke a function:
- Invoking the function “inline” : Simply open the query editor for your function query and click Invoke. You will get asked for parameters as needed. This is a very quick way of invoking the function, however it defeats the purpose of reusability since at this point the function will no longer be available from outside this query (given that the result is a table).

- Referencing the function: You can use the Reference option in the Query ribbon tab to create a new query in the workbook that references the current query. In this case, we could do this and be able to invoke our function from a new query.
- Invoking the function over a table: We can also use the “Insert Custom Column” option from a different query in order to invoke a function across all rows in the table. We can also make the function parameters be based on other columns from the table.
The third method is the one that we will use in this example, so for instance we could create a table with different cities in the King County area and invoke the GetRestaurants function for each row, so that we can get restaurants for each of the cities in the list.
First, we will create a table in the Excel sheet containing a list of cities, such as Redmond, Bellevue, Seattle, Kirkland, Issaquah and Sammamish.

Now we can go to the Data Explorer tab and click the “From Table” option. This will create a new query that references the sheet table. We can insert a custom column into this table by clicking on the table icon on the top-left corner of the table and selecting “Insert -> Custom…”
In the “Insert Custom Column” dialog, we can type in any custom formula using the Data Explorer formula language. In this case, we will simply invoke the GetRestaurants function using the following formula:

At this point, we will be asked for information about the privacy level of my workbook data. This is done so that users don’t accidentally leak data from a private or organizational source and inadvertently send it to a public source (like the Yelp API in this case). We will select “Public” in this case. You can learn more about Privacy Levels in Data Explorer in our Online Help pages.
After providing this information, the new column will be added to the table. Note that we have a new column with nested tables on each row (containing the restaurants for each of the cities) and we can expand these columns similarly to how we did earlier with the JSON records. We can also remove the “Cities” column since we don’t need it anymore.
Once we have expanded all columns, you may find that there are some duplicated rows. This is due to the fact that the Yelp API may return restaurants within a radius up to 25 miles (which can also be customized in the Yelp API parameters) so a given restaurant in Seattle might be returned when searching within Seattle and Bellevue, for instance. We can get rid of duplicated rows by selecting “Remove Duplicates” in the table menu (top-left corner of the table). This will leave us with approximately 60 candidate seafood restaurants, with their ratings and total number of reviews, as well as location information (Address, City, Lat and Long). We can select the Ratings, Review_Count, Latitude and Longitude columns and make sure they are formatted as Number by right-clicking the column headers and selecting “Change Type -> Number”. Finally, let’s also rename the query to “Seafood restaurants in King County”.

With this, we have the list of restaurants in the desired shape… We could just pick the highest rated restaurant in the list and make a reservation for Father’s Day, but of course we want to know first what the King County Food Establishment Inspections records have to say about each of these restaurants…
Import public data about Food Establishment Inspections from a CSV file
The next step in our scenario is to bring in public data from datakc.org (King County’s public data web site). We found this dataset which seems suitable for our needs, since it contains information about food inspections for the past 7 years, as well as the Name, Address and City for these restaurants (which we also have in our Seafood Restaurants query).
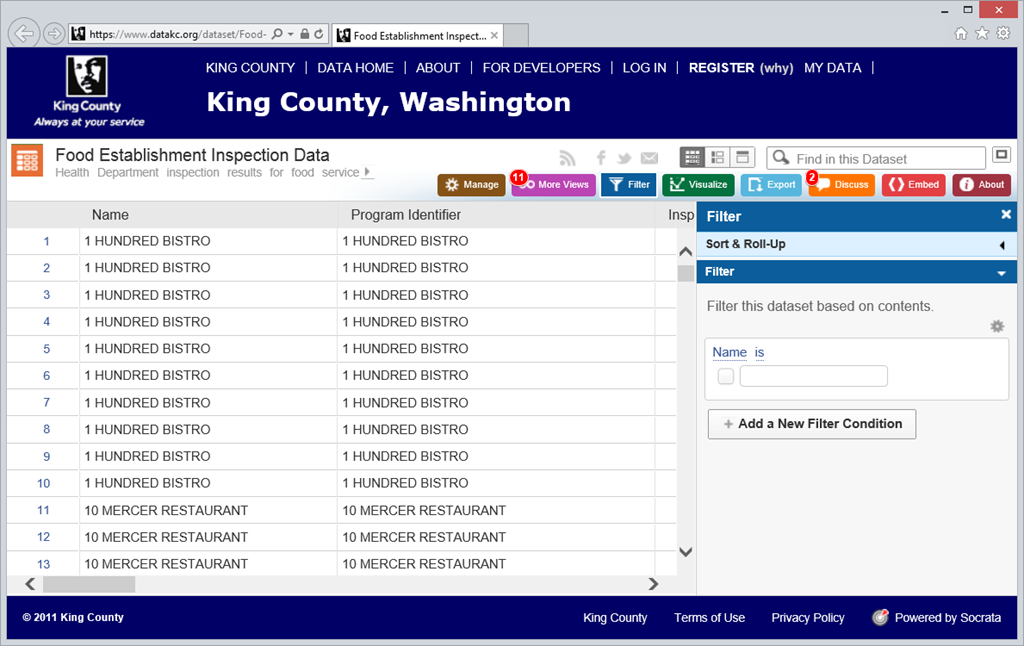
We can get to the CSV version of this dataset by clicking the Export option in the top-right corner of the page and we will get this URL for CSV: https://www.datakc.org/api/views/pph9-v8tz/rows.csv?accessType=DOWNLOAD
This link can be used directly in Data Explorer, either using “From Web” or “From File -> CSV”…

Once we have the inspections data loaded as a table, we can reshape it a little bit as we did earlier. The experience in the Query Editor is consistent regardless of what the underlying data sources look like on each case. We’ll do the following:
- Remove all columns except the following ones: Name, Address, City, Inspection Type, Inspection Result and Violation Description.
- We would like to focus only on the Unsatisfactory reviews, so we can filter the Inspection Result to only include those values.

- You will also notice that the Name and City columns contain values on uppercase and lowercase… This is something that we need to “normalize” so that when we combine this query with the Yelp Restaurants list we get matching rows. Let’s select the Name and City columns and use the “Transform -> Uppercase” option in the column menu (right-click in column header).
- Finally, let’s rename this query to Inspections and we will end up with a table similar to this one:

The next thing we need to do is go back to the Seafood Restaurants query and also turn the Name and City columns into Uppercase, as a preparation for being able to merge the two queries based on these columns.
Combining Yelp Restaurants list with Food Inspections data
Once we’ve normalized Name and City columns in both queries, we can go ahead and merge the two queries by using the Merge option in the Data Explorer ribbon tab. Before doing that, let’s enable Fast Combine for this workbook. This will turn off the Privacy Levels check for queries being combined in this workbook and we know that, since we already marked both as Public, this is OK. After enabling Fast Combine, we can click Merge.

This will launch the Merge dialog where we can select the two queries to merge as well as the columns to match. We will pick the Seafood Restaurants query as the left query, so that we augment this table with inspections data for those restaurants where the information is available in the Inspections table. We will multi-select (CTRL+Click) the Name and City columns in both queries to specify that both columns have to match.

The text at the bottom of this dialog will tell us that we got some matches, so some of the recommended restaurants in Yelp actually are not as recommendable as they would seem, according to the inspections results… We can click OK at any time and look at the newly created column as result of the Merge.
In this case, instead of expanding the nested columns we will perform an aggregate operation, which can be found also on the same dropdown menu in this column.

We are interested in the Count of Inspection Result values, which basically gives us the number of Unsatisfactory Inspections for each of these restaurants.
With that, we will get a new column like the one in the screenshot below.
Now we can use this information to decide which restaurant we should go to. Interestingly, restaurants with an average rating of 3 or lower are the ones which also got a higher number of unsatisfactory inspections… There are also some surprises with restaurants rated as 3.5-4 and getting a significant number of negative inspection results, so be aware of that the next time you check Yelp if you don’t want to take any risks!
Visualize restaurant locations, reviews and inspections results in Geoflow
To finish this post, we will put the resulting query into a nice Geoflow map. First, we need to load the final query into the Excel Data Model, which you can do by clicking the “Load to data model” option in the Query Settings pane. Once done, it will switch to a confirmation message as displayed below.

Now you can go to the Insert tab in the Excel ribbon and select “Map”. This will launch Geoflow where we can create a new tour with multiple layers to visualize our data.

Let’s create two different visualization layers, one for the food inspections, which we can represent as a heatmap and use the Inspections column for the value field, and another layer for the Yelp ratings, which we can represent as a Column chart and use the Review_Count as column height and the Restaurant Name as categories.
In order to add each of the layers, we will need to pick the Final Report table and select the Latitude and Longitude columns first and tell Geoflow to “Map It” based on these fields.

Then we can pick the Review_Count field and select Column type chart, using the Review_Count as the Height and the Name as Category.

Then, we can add another layer to incorporate the Inspections Count as a heatmap and add the Inspections Count as the Value field. This will give us the final map as displayed below.

Finally, we will get a map similar to this one. The taller columns represent popular restaurants and we should avoid the areas with red in the heatmap (which mean higher number of unsatisfactory reviews).
Hope you liked this blog post and the only thing left for us is to wish you and your family a happy Father’s Day!!