Data Explorer Online Search Overview
Working with data to gain new insights not only involves dealing with the data that you already have but also being able to find additional data to complement your analysis. In many cases, this additional data is publicly available to everyone but it has been traditionally difficult to find and to leverage in your analysis.
Because Public Data is essential in a variety of Self-Service BI scenarios, we added an “Online Search” feature in Data Explorer. This button is your first step to find data and import it right into your spreadsheet, without having to switch context.
This data can be used in a couple of different ways:
- To acquire and understand public data (e.g. find the list of most populated cities, the list of companies in S&P 500, etc.).
- To augment or correlate your (corporate) data with some publicly available data (e.g. find the name for an Airline code, or country name given an country code; compare your sales by country to the GDP by country, etc.).
Data Explorer makes it easy to search and bring the data directly in Excel without any need of copy/paste and reformatting. And once you create your queries, you can save them and refresh them later when the data is updated without effort.
In the current Data Explorer Preview, this feature allows you to search and seamlessly import tables from Wikipedia (approximately 1.5 million tables); and going forward we will extend the scope of the search and allow query over a variety of other sources.
With millions of tables we are sure you will find a good use of public data. We are listening to your feedback, so let us know what you think of this feature and what kind of data sources you are using in your own scenarios!
Step-by-step example
Let’s go thru a simple example step by step. In this example, Michael, a business analyst working in a company owning several luxury retail stores in the USA, is investigating for a location for their next store. Starting with a current list of stores, he wants to visualize potential counties where he could open new stores based on their median income. The whole scenario takes him less than 5 minutes.
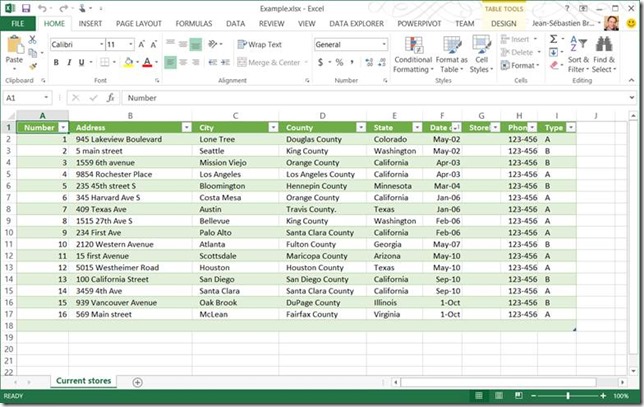
Step 1. Michael starts by a spreadsheet containing a list of current stores.
Figure 1. Initial spreadsheet, with the list of current stores (Step 1)
Step 2. Michael adds the list of current stores as a first Data Explorer query.
For that, he clicks on the “From Table” button in Data explorer and validates the next form. The table is added as a new query in a new sheet.
Step 3. He initiates the search, by clicking onthe “Online Search” button in Data Explorer tab.
Step 4. Search for the highest income counties in United States:
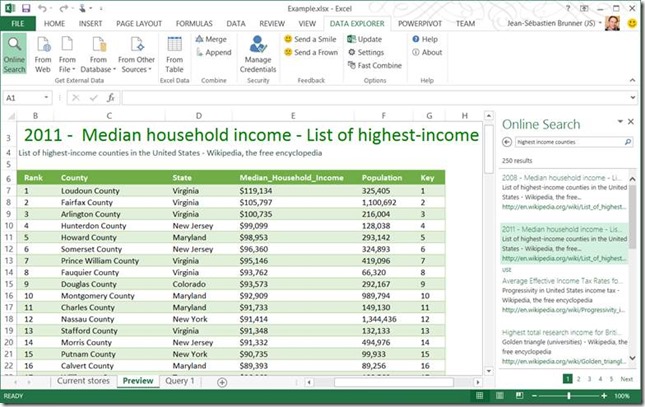
Michael types “highest income counties USA” in the Online Search pane. He can see the search results, and have a preview of the data while moving the mouse over each result.
Figure 2. Search pane and preview (Step 4)
Step 5. Use the data:
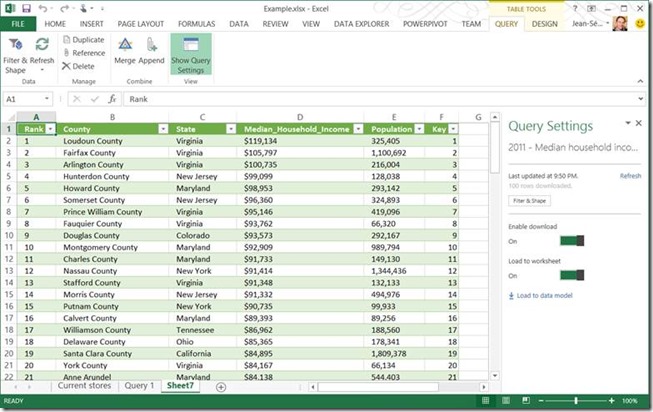
When he finds the result he was looking for (here the second one), he clicks on “Use”. The data is then automatically imported into Excel as a new query. At this point the data is in Excel and he can use all Excel features (sort, filter, charts, etc.). He can also choose to merge this query with another query, or to reshape it using Data Explorer.
Figure 3. Data imported into Excel (Step 5)
Step 6. Merge initial data and public data.
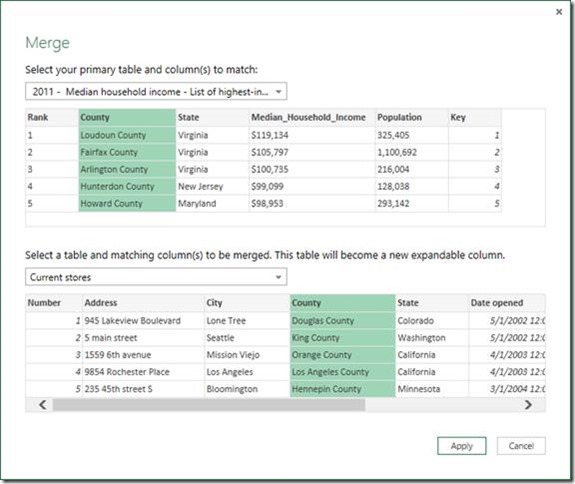
Clicking on the “Merge” button, Michael can merge the two queries created so far, based on the County column.
For that, he selects the Wikipedia table as primary table, and the list of current stores as second table, then clicks on the County column in both table, and then clicks on apply.
Figure 4. Merging the two queries (Step 6) based on County
Step 7. Michael adds some additional columns.
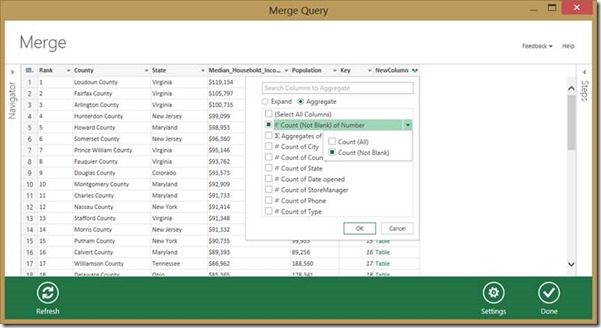
In order to know the number of stores in each country, he right clicks on the column header, and then clicks on “NewColumn”, choose aggregate and then Count/Excluding blanks (see following picture). This will simply add a column with the number of existing stores in each county.
Figure 5. Add an aggregate column (Step 7)
Michael also adds a column to aggregate the County and State together (this is to disambiguate the map visualization in next step). For that, Michael right-clicks on a column header again and choose “Insert Column” then “Custom” and add the following formula:
= [County] & ", " & [State]
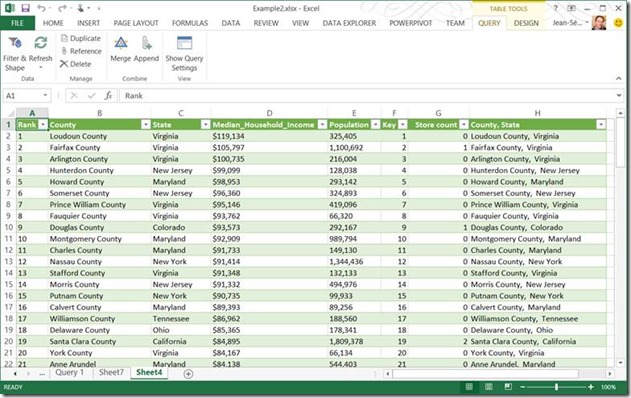
After validating the form, Michael sees the following table in Excel.
Figure 6. End of step 7 with new columns
Step 8. Visualize the data with PowerView.
Michael goesto the “Insert” tab in Excel, and then clicks on “PowerView”.
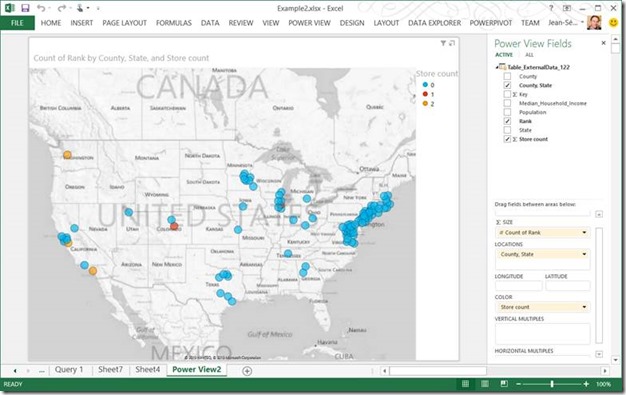
He then clicks on the Map button and configures the view as follows:
- Sum Size: Rank
- Location: County, State (our second new column)
- Color: Store count (our new aggregate column)
- (no other field is used)
And finally, Michael gets the following map showing the highest income counties, with the color indicating the number of existing stores for Michael’s company.
We believe this scenario demonstrates the value of Data Explorer in helping users discover data, filter and shape the data easily and combine with other data. Finally, users can analyze the data or build visualizations on top.
Please let us know what you think about Online Search, and Data Explorer in general!
