Accessing a Visual Generated from R Code in AzureML
By Philip Reilly, Solution Architect
One of the reasons that the R language is so popular is its extensive data visualization support. There are a large number of packages that provide a broad range of advanced data visualization capabilities.
These visualization capabilities can be used from within AzureML. The execute R module enables users to write R and generate visualizations in just the same manner as can be achieved when running R locally.
However, one of the challenges related to creating data visualizations with using R in AzureML is how you share these visualizations with others.
In this post I'll show you one way you can make the visualizations you create in AzureML available via a web site for others to view.
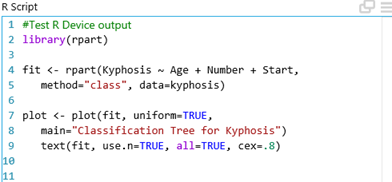
If we start with a simple AzureML experiment, composed of a single Execute R module, then we can create a visual using the following R code.
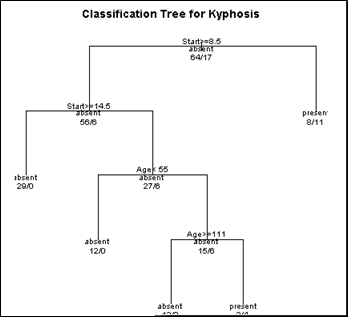
If we then save and run the experiment, it will generate a plot. By right-clicking on the R Device port on the Execute R module and selecting visualize we are presented with the following plot.
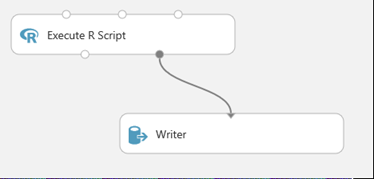
We then add a Writer module to the experiment and connect it to the R Device port. This gives an experiment that looks like the following.
Next we configure the writer module to save the R Device output to a file in blob storage. The file format isn't relevant in this case, and can be set to CSV.
You can then save and run the experiment again. If you then view the content of the file written to blob storage you will see that it actually contains JSON markup. Within the markup there is an element called 'Graphics Device', which contains a collection of base64 encoded strings. Each of these strings represents one of the visuals created by the R code in the Execute R module.
These base64 strings can be extracted and converted to an array of bytes and saved to a new image file. The format of the image is PNG.
One way of performing this processing would be to use an Azure web site. An ASP.NET web site could be created to provide access to the images. When a user accesses a web page providing access to one of the R code visuals, the above processing could be performed, and the image of the R visual presented within an IMG tab.
The following code shows how this can be done. The code has been added to the code behind file for an ASPX page.
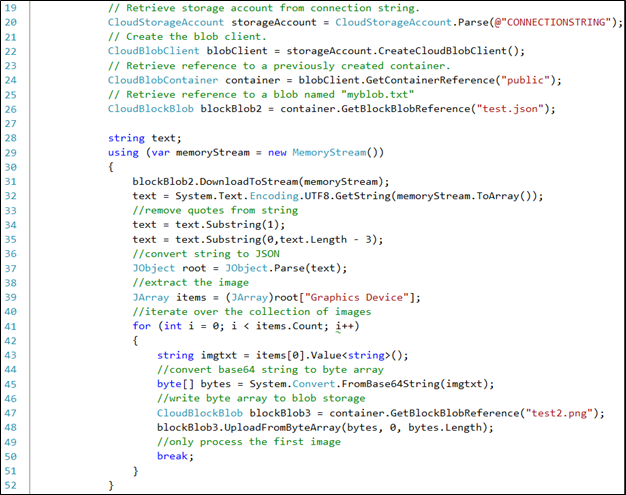
The code uses the Azure Storage library to retrieve the JSON file from blob storage. In this example the file is stored within a container called public, and the name of the file itself is test.json.
The JSON within the file is actually surrounded by quotes. Before attempting to process the JSON the quotes need to be removed.
The Newtonsoft JSON library is then used to process the JSON markup and extract the first base64 string from the Graphics Device collection. The string is decoded and converted into a byte array. The byte array is then written back to an image file that is also stored within blob storage.
The code performs this processing every time the web page is accessed. A more efficient approach would be to only perform the processing when required. For example, the respective files could be checked to determine whether the JSON file had been updated following the last time the PNG file was created, and then the above processing performed.
The final step in the process is to present the PNG image on a web page. This can be done using the following HTML markup.
