Event Hubs / Stream Analytics / AzureML / PowerBI End-to-End demo – Part I (Data Ingestion and Preparation)
By Alexander Turetsky, Solution Architect
For one of the engagements I was working on I've created a demo that connects various Azure services into a complete picture showing all parts of an IoT Predictive Maintenance scenario from data ingestion to data insights visualization.
The AzureML team has published a Predictive Maintenance template showing techniques used to predict when an in-service machine will fail, so the maintenance could be planned in advance. If one follows step-by-step instructions provided by the template at the end you will get a trained model and a published Web Service that would accept some input data and produce a prediction based on it. But the template is missing any information how to collect data from devices (engines), pass it to the model, and utilize the output.
This is a high level architecture view of the demo setup.
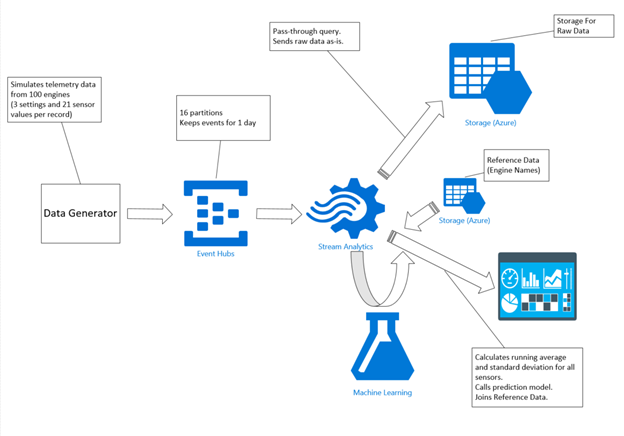
The demo uses "Turbofan Engine Degradation Simulation Data Set" published in NASA Ames Prognostics Data Repository (https://ti.arc.nasa.gov/tech/dash/pcoe/prognostic-data-repository/).
The Data Generator – a console application – reads that data from a local file and sends it to Event Hubs record-by-record. Stream Analytics job reads the data off Event Hubs, stores it as is in the cloud storage, enhances it on the fly with calculated attributes, calls Machine Learning model, joins the static Reference Data and sends the results for visualization to PowerBI dashboard.
So in this post I will concentrate on the data ingestion part of the demo.
Azure Event Hubs is a very scalable, durable and fast data ingress service. It can process millions of events per second. Every event can be up to 64KB in size and can be retained in the Event Hubs for up to seven days. There is a notion of throughput units - each unit entitles all Event Hubs in a Service Bus namespace to up to 1MB per second of ingress events, up to 2MB per second of egress events and up to 84GB of events storage. There is a default quota of up to 20 throughput units per namespace; it can be increased via a support ticket.
Data can be sent to Event Hubs via HTTPS or AMQP protocols. HTTPS is generally much slower than AMQP (up to three times overhead).
Partitions are a data organization mechanism and are more related to the degree of downstream parallelism required in consuming applications than to Event Hubs throughput. You can have from 2 to 32 partitions per Event Hub (could be increased via a support ticket). While partitions are identifiable and can be sent to directly, it is generally best to avoid sending data to specific partitions.
You can send events to Event Hubs synchronously and asynchronously either individually or as a batch of events (a cumulative size of all events in a batch should not be greater than 256KB). Sending asynchronously can significantly increase the rate at which events are sent to the Event Hub, but there is a trade-off you need to be aware of: Event Hubs service might start throttling your events if you go over your purchased limits (throughput units) and if you send events asynchronously you would not have any feedback from the service that some of the events are actually dropped; if you send synchronously and an event (or a batch) is throttled, you have a clear indication in the response that this has happened.
.NET SDK provides a very easy and intuitive APIs for clients that send events to Event Hubs.
The primary class for interacting with Event Hubs is EventHubClient; there is a convenient static method to instantiate it:
client = EventHubClient.CreateFromConnectionString(connectionString, eventHubName);
that takes a service bus connection string and the name of the Event Hub you want to connect to as parameters. Once the client is created, you can use the following methods to send data:
client.Send(EventData);
client.SendAsync(EventData);
client.SendBatch(IEnumerable<EventData>);
client.SendBatchAsync(IEnumerable<EventData>);
An instance of EventData object could be created from a byte array, a stream, or any object with a proper XML Object Serializer (or its derivative). Azure Stream Analytics service currently supports JSON, CSV or AVRO serialization formats for the incoming stream data. For the demo I've decided to use JSON and here is a quick code snippet how EventData instances could be created:
var serializedString = JsonConvert.SerializeObject(obj);
EventData data = new EventData(Encoding.UTF8.GetBytes(serializedString));
The Data Generator console application is used as the simulation of the real engines sending their telemetry data to the system. In order to be more realistic, we could start 100 instances of the application (one per each engine in the data set) and the data would flow simultaneously. If you want to increase the throughput of a single client there is one very important piece of information to take into account. All additional EventHubClients obtained via static helper methods will reuse the same underlying TCP connection; thus they would have a client-side limit on throughput. In order to overcome this limitation you can create multiple messaging factories and one EventHubClient object from each factory.
var factory = MessagingFactory.CreateFromConnectionString(connectionString);
var client = factory.CreateEventHubClient(eventHubName);
The data set used in the demo contains information from 100 airplane engines. Each record consists of 3 engine settings and readings from 21 different engine sensors. The total size of the data set is about 20.5K records.
For more information about programming Event Hubs clients using .NET SDK you can refer to this link.
The creation of Event Hubs could be easily automated using .NET SDK or Powershell scripts. The demo package contains Powershell scripts to setup a demo environment and it could be used for code samples. One of the plans for future enhancement of the demo is to start using Azure Resource Manager to set up the environment.
There are couple of important points to mention related to Powershell scripting. First of all you need to include the .NET assembly for Service Bus into your Powershell environment. The demo archive contains a version of this assembly, so it could be used. Otherwise if you install Service Bus NuGet package, the assembly would come with it.
This is a snippet of how you can include the assembly:
$sbpath = (Get-ChildItem -Path .\ -Include "Microsoft.ServiceBus.dll" -Recurse)[0].FullName
Add-Type -Path $sbpath
After that you can instantiate a NamespaceManager
$NSManager = [Microsoft.ServiceBus.NamespaceManager]::CreateFromConnectionString(connectionString);
And use all functionality available in it, such as creation of an Event Hub:
$EventHubDescription = New-Object -TypeName Microsoft.ServiceBus.Messaging.EventHubDescription -ArgumentList $EventHubName
$EventHubDescription.PartitionCount = 8
$EventHubDescription.MessageRetentionInDays = 1
$NSManager.CreateEventHub($EventHubDescription)
More information about managing Service Bus (and everything related to it) could be found in this great post.
Azure Stream Analytics – is a service in Azure that allows real-time data processing in the cloud (once the data has been ingested). ASA service usually goes hand-in-hand with Event Hubs – the data in ingested via Event Hubs and ASA provides a SQL-based querying mechanism on top of this data stream. Using Stream Analytics jobs you can fork the data stream into hot and cold paths, do data filtering, duplication and enrichment, merge multiple streams together and get initial insights from your data.
There are two queries that process the streaming data in the demo. First query is very straight-forward – it stores incoming data as-is in the cloud storage:
SELECT *
INTO historystore
FROM rawinputdata TIMESTAMP BY tmstmp;
The second query is responsible for data enhancement needed by the ML model – for each sensor we need to calculate a running average and a running standard deviation values. Since the number of sensors is quite big, there were some hiccups to overcome. The problem is that current implementation of Stream Analytics jobs has some limitations – you can use up to 5 subqueries and each subquery can have up to 14 aggregate functions in total. That's why the second query looks quite hairy.
with part1 as (
select id, max(cycle) as cycle, 518.67 as a1, avg(s2) as a2,
avg(s3) as a3, avg(s4) as a4, 14.62 as a5, avg(s6) as a6,
avg(s7) as a7, avg(s8) as a8, avg(s9) as a9, 1.3 as a10,
avg(s11) as a11, avg(s12) as a12, avg(s13) as a13, avg(s14) as a14
FROM rawinputdata TIMESTAMP BY tmstmp
GROUP BY SlidingWindow(mi, 1), id HAVING COUNT(*) > 5
),
part4 as (
select id, max(cycle) as cycle, avg(s15) as a15, 0.03 as a16,
avg(s17) as a17, 2388 as a18, 100 as a19, avg(s20) as a20,
avg(s21) as a21, 0 as sd1, stdev(s2) as sd2, stdev(s3) as sd3,
stdev(s4) as sd4, 0 as sd5, stdev(s6) as sd6, stdev(s7) as sd7
FROM rawinputdata TIMESTAMP BY tmstmp
GROUP BY SlidingWindow(mi, 1), id HAVING COUNT(*) > 5
),
part6 as (
select id, max(cycle) as cycle, stdev(s8) as sd8,
stdev(s9) as sd9, 0 as sd10, stdev(s11) as sd11,
stdev(s12) as sd12, stdev(s13) as sd13, stdev(s14) as sd14,
stdev(s15) as sd15, 0 as sd16, stdev(s17) as sd17, 0 as sd18,
0 as sd19, stdev(s20) as sd20, stdev(s21) as sd21
FROM rawinputdata TIMESTAMP BY tmstmp
GROUP BY SlidingWindow(mi, 1), id HAVING COUNT(*) > 5
),
aggregates as (
SELECT part1.id, part1.cycle,
part1.a1, part1.a2, part1.a3, part1.a4, part1.a5, part1.a6,
part1.a7, part1.a8, part1.a9, part1.a10, part1.a11, part1.a12,
part1.a13, part1.a14, part4.a15, part4.a16, part4.a17, part4.a18,
part4.a19, part4.a20, part4.a21, part4.sd1, part4.sd2, part4.sd3,
part4.sd4, part4.sd5, part4.sd6, part4.sd7, part6.sd8, part6.sd9,
part6.sd10, part6.sd11, part6.sd12, part6.sd13, part6.sd14,
part6.sd15, part6.sd16, part6.sd17, part6.sd18, part6.sd19,
part6.sd20, part6.sd21
FROM part1
JOIN part4 ON DATEDIFF(ms, part1, part4) = 0
AND part1.id = part4.id and part1.cycle = part4.cycle
JOIN part6 ON DATEDIFF(ms, part1, part6) = 0
AND part1.id = part6.id and part1.cycle = part6.cycle
)
SELECT
r.id, r.cycle, r.tmstmp, r.setting1, r.setting2, r.setting3,
r.s1, r.s2, r.s3, r.s4, r.s5, r.s6, r.s7, r.s8, r.s9, r.s10,
r.s11, r.s12, r.s13, r.s14, r.s15, r.s16, r.s17, r.s18, r.s19,
r.s20, r.s21, a.a1, a.a2, a.a3, a.a4, a.a5, a.a6, a.a7, a.a8,
a.a9, a.a10, a.a11, a.a12, a.a13, a.a14, a.a15, a.a16, a.a17,
a.a18, a.a19, a.a20, a.a21, a.sd1, a.sd2, a.sd3, a.sd4, a.sd5,
a.sd6, a.sd7, a.sd8, a.sd9, a.sd10, a.sd11, a.sd12, a.sd13,
a.sd14, a.sd15, a.sd16, a.sd17, a.sd18, a.sd19, a.sd20, a.sd21
INTO forml
FROM rawinputdata r TIMESTAMP BY tmstmp
JOIN aggregates a ON DATEDIFF(ms, r, a) = 0
AND r.id = a.id and r.cycle = a.cycle;
Azure Stream Analytics jobs could also be easily created using Powershell scripts. There are some limitations as of now (such as PowerBI output creation is not supported yet, and this has to be done manually). The entire ASA job is defined in a JSON file and there is a simple cmdlet to provision the job in Azure:
New-AzureStreamAnalyticsJob -Name $jobName -ResourceGroupName $ResourceGroupName –File "SendToPowerBI.json" –Force
Both Event Hubs and Stream Analytics services now a part of Cortana Analytics Suite playing the major role of data ingestion and initial analysis. In the next article I would describe how to do the prediction via Azure Machine Learning.