Getting started with Self Service BI using Power View
Self Service BI capability is “THE” thing that senior executives want. IT on the other hand want it too. No matter how often the report format has been scrutinized there is always a tweak required which would
make the IT team very transactional and operational. Reporting tools no doubt have evolved over a period of time. Sorting by any column in ascending or descending column is a given. Also columns can be reordered to see comparable columns one next to the other. Most reports are made generic with filters so that a wide variety of users can use it.
PowerView is available in Excel 2013. In order to enable PowerView
please follow the steps below
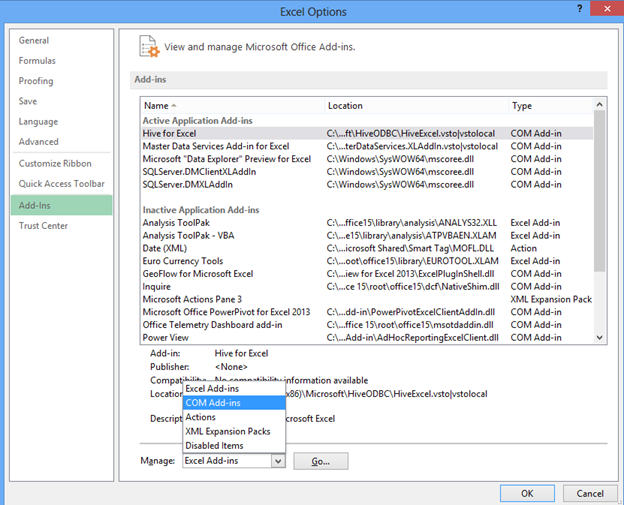
Go to File > Options > Choose Add Ins
From Manage at the bottom of the page, select COM add ins
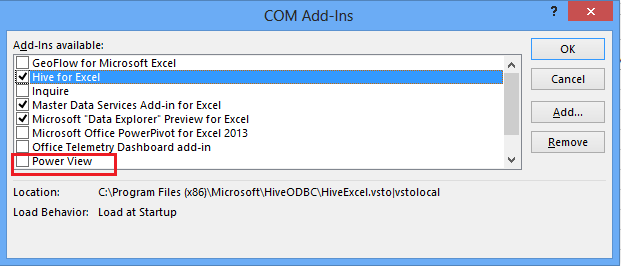
Post this whenever you import data into Excel, you will have the option of opening it in PowerView format
Let us try an example
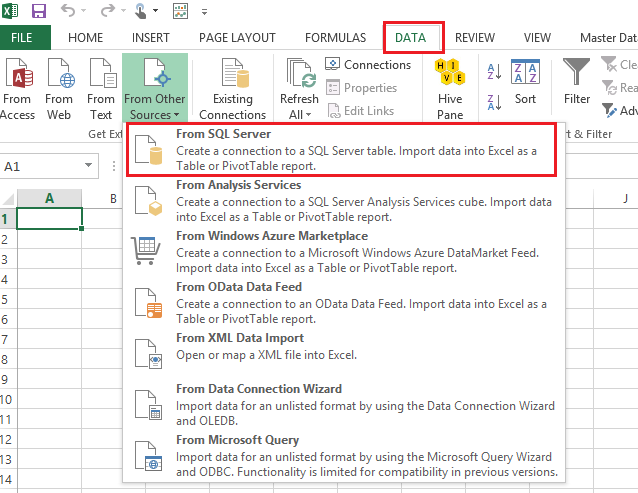
- Using ribbon go to DATA tab
- Click on from other data sources
- Choose SQL Server (to use an existing SQL Server database)
- Type in the name of the server and supply it with credentials or choose Windows authentication
- Select the database that contains the data you want
- You can connect to a specific table or select multiple tables.
- You can also select related tables. Related tables will be added into the selection based on foreign key constraint
- A data connection file is saved on the local computer.
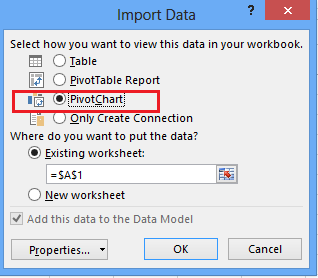
Import data as Pivot Chart as shown
All fields are shown from which you can select dimensions and measures needed and create appropriate charts
All data sets so created can affect other charts. Create simple pie charts, bar charts to begin with. Fill up sheets with 4 data sets
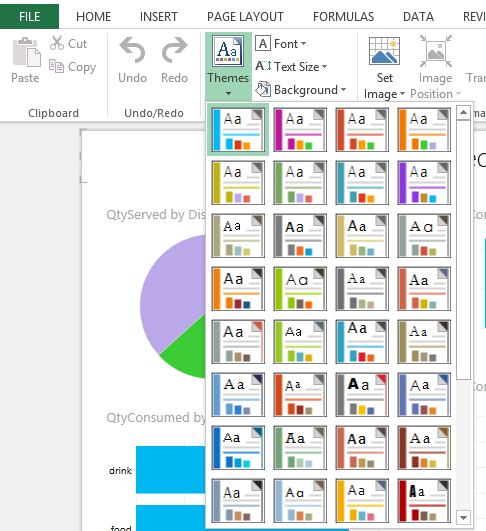
You can choose different themes to change the color scheme
You can also color the background
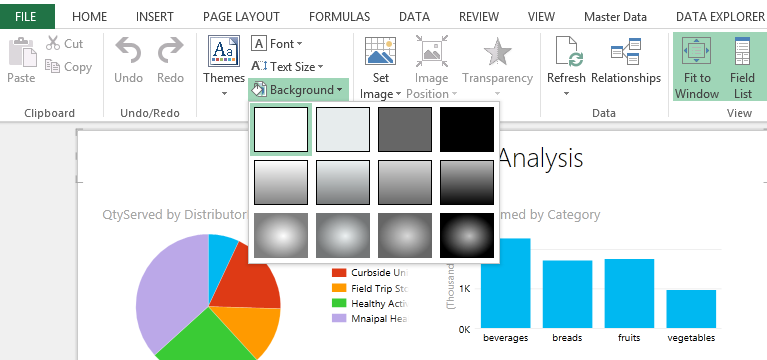
A presentation ready dashboard is ready in minutes.
Share it on a collaboration medium such as SharePoint
Enable Power Users to create their own story.