Data Visualization (Reporting) Options
How important is data visualization?
A picture can convey a thousand words. Human beings respond greatly to visual cues. A visual cue gives greater depth in the least possible time. Hence Business wants data represented pictorially as well.
The needs of business are so varied that no one single solution fits all scenarios. Hence there are many options. Now, the question is which one to use when? Some of the tools overlap and addresses multiple needs.
Data Visualization tool is influenced by
- Nature of data: structured or not-structured
- Who has authorized it?
- What is the end use?
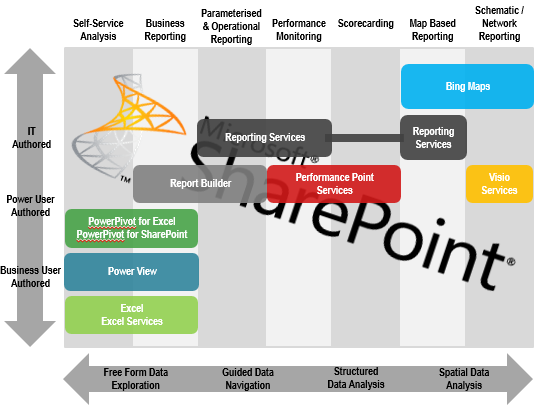
The picture below tries to capture the different scenarios in which different reporting tools are available to be leveraged.
A quick look at the options
- Excel Services: Excel Services is a Microsoft Office SharePoint technology that makes it simple to use, share, secure, and manage Microsoft Office Excel 2007 workbooks and above (.xslx, xslb) as interactive reports in a consistent way throughout the enterprise.
- PowerView: Power View, a feature of SQL Server 2012 Reporting Services Add-in for Microsoft SharePoint Server 2010 Enterprise Edition and above versions, is an interactive data exploration, visualization, and presentation experience. It provides intuitive ad-hoc reporting for business users such as data analysts, business decision makers, and information workers. They can easily create and interact with views of data from data models based. Power View is a browser-based Silverlight application launched from SharePoint Server 2010 that enables users to present and share insights with others in their organization through interactive presentations.
- PowerPivot: SQL Server PowerPivot for Excel is a new add-in that extends Excel 2010 and above versions to support extremely large datasets that you create based on heterogeneous data from corporate databases on a network, public data on the web, or local data on your computer. Additional capacity is available through a separate PowerPivot window that you open from within Excel. Within this window, you use column mapping to establish relationships between similar data from different sources. The end result is a new data source embedded within the workbook that becomes the basis for interactive PivotTables and PivotChart reports you create in the same (.xlsx) file.
- Report Builder: Microsoft SQL Server Reporting Services Report Builder is a report authoring tool that features a Microsoft Office-like authoring environment and new features such as new sparkline, data bar, and indicator data visualizations, the ability to save report items as report parts, a wizard for creating maps, aggregates of aggregates, and enhanced support for expressions. Difference between PowerView and Report Builder can be found at - https://pulse.sqlserverpedia.com/blog/is-power-view-meant-to-replace-reportbuilder/
- Reporting Services: SSRS is a server based report generation software system. Administered via a web interface, it can be used to prepare and deliver a variety of interactive and printed reports
- Performance Point Service: PPS enables creation of rich, context driven dashboards where data is integrated into sharepoint in a native and interactive way. It uses the power of analysis while maintaining the control and security that business needs
- Bing Maps: Visual representation of geographical information
- Visio Services: Visio Services in Microsoft SharePoint Server 2013 enables you to load, display, and interact programmatically with Visio .vsdx, .vsdm files and Visio Web Drawings (.vdw) on Microsoft SharePoint Server 2013 and Microsoft SharePoint Online
Lets demystify the above in the following blogs