Let’s assume we have data about projects, and we want to rank the projects by budget, so that if we filter the data by some criteria (i.e. region, country, or some other classification) the ranking recalculates for the new scope. We also want some metrics calculated for the TopN projects, i.e. total budget for TopN and percent to overall budget. But most importantly, we want TopN to be a dynamic selection, meaning that in using the report, we want to focus on Top5, or Top10, or Top15, etc. by changing our selection at any time.
Power BI Desktop supports DAX for calculations and data analysis problems. DAX (Data Analysis eXpressions) is a collection of functions, operators, and constants that can be used in formulas or expressions to calculate and return values. A couple of those that we’ll use here are RANKX and TOPN (see the full DAX Function Reference here).
So, we need to rank the projects first. Then we need to implement the option’s selection of the TopN. Then we define the metrics. And finally, we put everything together with some charts & tables using Power BI Desktop.
We will rank the projects by total budget, so we need a “Total_Budget” (with an underscore) measure (not a field, as we need some aggregation), based on the “Total Budget” (without underscore) field… both of these from the “Budget” table:
Total_Budget = SUM(Budget[Total Budget])
On the table of Projects, we create a new measure by right-clicking the “Projects” table on the right-hand pane for Fields (or clicking the “…” to the right of it):

And we define the measure (named “Rank” in this case) as follows:
Rank = RANKX(ALL(Projects), Budget[Total_Budget], ,DESC)

- As this measure is on the “Projects” table, the default context for the measure will be the row for which it’s being calculated… and we don’t want the ranking to happen only for that row, but for all the Projects (hence the “ALL(Projects)” as the scope for the ranking).
- Then we define the criteria for ranking the projects; in this case, the total budget for each project that comes from the other measure in the “Budget” table indicated above, with the filtering context of these two tables being related to each other (there’s a relationship between Projects and Budget thru ProjIDs).
- And finally, the bigger the budget, the first to be ranked… so it’s in DESCending order.
Now we can use this measure in a table with other Projects’ fields, and order by it in ranking order by descending total budget.
2. Option’s Selection for TopN
We want to allow the selection of TopN, where N could be 5, 10, 15, 20, etc. So, we can use a couple features of Power BI Desktop that allows us to create a table by entering our own data (manually or copy/paste from i.e. Excel). This feature is called “Enter Data” in the “External Data” group on the “Home” ribbon:

Which opens the “Create Table” dialog, in which we can name the table, create columns, and enter data for it (or copy/paste from i.e. Excel):


The “Load” button will create the table; the “Edit” button will open the table in Query Editor in case we want to make additional modifications.
How will we use this table? We’ll add a filter visualization to the canvas, so these values will be filter options for us to choose from. From the runtime perspective, when we filter a table by a slicer, only records where the criteria is true will be in context, cross-filtering other tables related to it. In this case, there’s no relationship to other tables, but we can create a measure in this new table that will hold the value that was chosen, and then we can use it in other measures’ calculations later… so, we create the following measure on this new “TopN Options” table:

- The “MIN” function will ensure that in case the user selected multiple options, only the first will be considered in subsequent calculations.
Now that we have the selection of TopN, we can create a couple measures on the “Projects”:

- This calculates the total budget for the TopN projects.
- The TOPN function takes the value for N (calculated previously from selecting it in the filter with the previous step).
- Then it takes the Table to get the TopN from, and the criteria for deciding what the TopN are.
- This function has some similarities with RANKX, in that it calculates the rank of the projects based on total budget descending, and selects the TopN (instead of just returning the rank’s value).
The second measure will calculate the percentage of this total budget for TopN projects, against the overall total budget:

Another measure we can use for displaying on tables, relates to highlighting which projects are the TopN based on current selections, by returning an arrow we can use as a field in the table for the TopN projects:

- If the rank for a given project is less or equal to the TopN value selected by the user, then an arrow will be returned for display/highlighting in a table.
4. Using all these with Charts and Tables
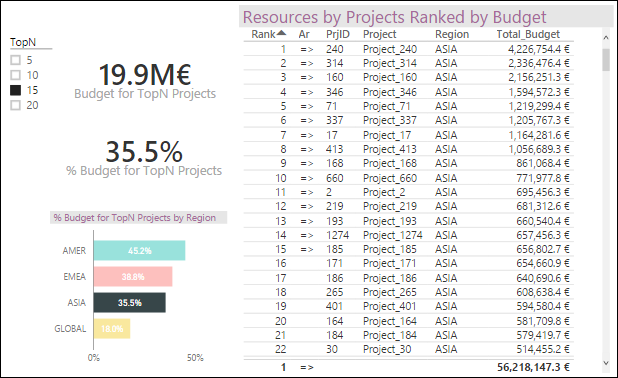
Here’s how we could display some of these measures and fields:

- The filter is an Slicer configured as:

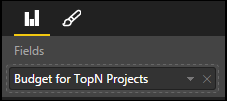
- The two metrics are Cards configured as:


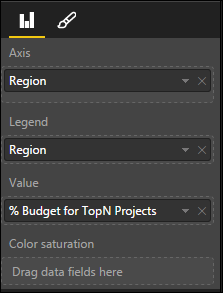
- The bars are Stacked Bar Chart configured as:

Then we could have a table with fields from Project and Budget and some of these new measures, ordered by the Rank column:

Which is a Table visualization configured as:

So, if we select Top15, it all gets filtered accordingly:

Taking advantage of Power BI’s cross filtering, if we select the bar for “Asia”, all other controls will get cross filtered, the ranking recalculated to this new subset of projects, and we effectively get the information for the “Top15 projects in Asia”:

A final example for the “Top10 projects in Europe”:

Which tells us that “the Top 10 projects in Europe represent 31.7% of the total 32MM Euros (the total of the table’s column for budget) across all projects there, amounting to 10.2MM Euros, where the Top3 reach about 4.8M Euros (the first three rows)”.
- Anonymous
March 20, 2016
Hi, i would like to reproduce this article, what datasource did you used ?
- Anonymous
May 25, 2016
Really useful examples; is there a way to show to cumulative value of the budget in another column?. Please advise.
- Anonymous
June 24, 2016
The comment has been removed
- Anonymous
November 23, 2016
The comment has been removed
- Anonymous
August 05, 2016
To select TOPN customers .use below methodStep1: Group the customers and put them in a new tabletable=groupby('product','product'[company_name],"count",sumx(currentgroup(),product[invoice total])Step2: Create a rank measure in the original 'Product' tableStep3: rank=rankx(all('table'),'product'[total_invoice]where (another measure in table product ) Total_invoice = sum('product'[invoice total]Create a chart and selectCompany name from 'Table'Invoice Total from 'Product'Put measure' rank' as filter and value = less than 11 (for Top 10 customers)If you want to dynamically select TOP10 TOP20 or TOP30 customer thenCreate a new table TOPN with column name TOPN and values (10,20,30)Add a new column to it SelectedTopNNumber=MIN('TOPN'[TopN]) add another measure to original table -- Check = if([rank] <= [SelectedTopNNumber] ,1,0)Add the column TOPN as a slicerAdd measure 'check' as a filter with value =1Enjoy dynamic selection of TOPN customers
- Anonymous
January 05, 2017
following the steps above, I get all of my ranks as 1? Help
- Anonymous
January 10, 2017
Did you create the rank as measure in new table or original table?
- Anonymous
February 14, 2017
HI , this is not worked with if we deal with RLS(Row level security ) when we apply role rank become 1 for all the items.
- Anonymous
February 16, 2017
Really helpful information, thank you for posting this.!I am relatively new to DAX and Power BI - followed your example through - mostly worked, however I noted that the % of TopN projects was inaccurate - showing % and totals for all projects? Please can anyone advise on what I have done incorrectly here.Please note metric cards accurately reflect TopN budget and % and table with ranking is accurate - Chart does not reflect % (as part of TopN budget)
- Anonymous
February 21, 2017
Hi,We have a requirement to get the top 20 records based on revenue.I have used the rank concept.The rank is same for multiple records as the value is same.In filter criteria if its given rank < 20 then the number of records displayed will be more than 20 right.How can we proceed?
- Anonymous
April 24, 2017
I am trying to rank my data in Power Pivot but I have an issue.For a list of 5000 clients I have daily data and want for every date or any other frequency to create a rank measure that will dynamically adjust and rank the data for the respective period. any ideas how to achieve this?thank you in advance for your help.
- Anonymous
May 30, 2018
Hi Daniel,thank you for your post.Could you please explain how to group values by categories which do not include in TopN?
- Anonymous
May 30, 2018
Hi all... Sorry I've been disconnected; I changed jobs a couple years ago to a different discipline and couldn't keep up. When I wrote this article, Power BI didn't have TopN filters, Binning, Grouping, and Inclusion/Exclusion of data points. All these features were released October 2016 (see https://powerbi.microsoft.com/en-us/blog/power-bi-desktop-october-feature-summary/). HTH...


