Viewing Emitted IL
Let's say you're working on a project such as IronPython or IronRuby that makes use of Reflection.Emit to generate code at runtime. You're probably used to seeing a stack trace in Visual Studio that looks something like this:
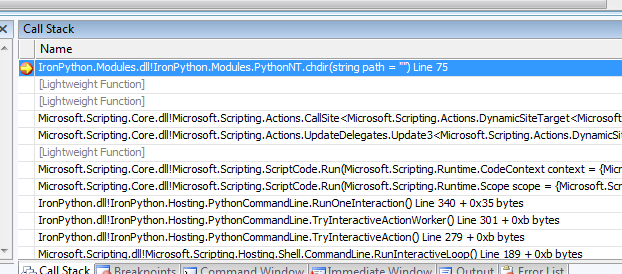
Visual Studio will do its best to prevent you from viewing any part of that [Lightweight Function]. It won't let you trace into those methods, even while viewing from assembly language. If you're feeling clever, you can use the registers view and the and memory view to identify the return address on the stack, but there's no way of knowing for sure whether or not the caller is actual code or just a thunk of some kind.
But it turns out that there's another way of doing this that's fairly straightforward.
Enter SandWindbag
The managed debugger operates at a fairly high level of abstraction (as far as debuggers go). So when the going gets tough, the tough resort to windbg.exe (or its command-line cousin cdb.exe). These are part of the Debugging Tools for Windows, which can be downloaded from https://www.microsoft.com/whdc/DevTools/Debugging/default.mspx.
Here's what you need to do.
1. If you're not viewing it in Visual Studio already, bring up the Debug Location toolbar, which looks like this:
![Process: [7172] ipy.vshost.exe Thread: [1440] Main Thread](https://msdntnarchive.blob.core.windows.net/media/TNBlogsFS/BlogFileStorage/blogs_msdn/curth/WindowsLiveWriter/ViewingEmittedIL_11275/thread_1_2.png)
This will tell us the name and id of the process and thread that we need to connect to from windbg.
2. If you haven't already, start windbg. From the File menu, select Attach to a Process -- or hit F6.
Here's the key part. When you select the process for connecting, you want to specify that it's a noninvasive attach:
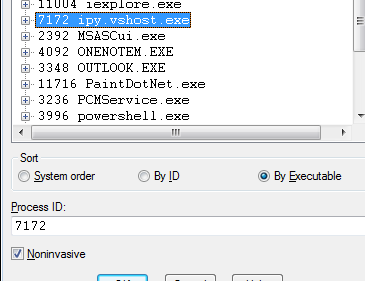
In Windows, only a single process can connect to any given other process as the debugger. Visual Studio is already the registered debugger for this instance of IronPython, so windbg cannot establish the same relationship with it. What "Noninvasive" debugging does is to use SuspendThread to suspend all the threads in the target process and then use ReadProcessMemory to access its internals. At that point, it's not unlike debugging a core dump; you have the entire memory image to look at, but you can't actually set breakpoints or execute any code inside that process.
There's plenty of information about noninvasive debugging at various locations on the net.
For our needs -- looking at the MSIL and the native machine code for methods generated through Reflection.Emit -- this turns out to be good enough.
3. Now we'll want to load the SOS Debugging Extension. This actually ships with the .NET runtime now, so there should be nothing for you to load. Unfortunately, the ".loadby" windbg command doesn't seem to work when we do a noninvasive connect, so you'll have to type a full path in the command to load the extension. With a default installation of Windows, this will probably be
.load C:\Windows\Microsoft.NET\Framework\v2.0.50727\SOS.dll (for a 32-bit process), and
.load C:\Windows\Microsoft.NET\Framework64\v2.0.50727\SOS.dll (for a 64-bit process).
4. Let's make sure that we're looking at the right thread. You can get a list of threads by using the "~" command, or you can choose "Processes and Threads" from the View menu. The thread identifiers here are expressed in hexadecimal, so you'll need to do a quick conversion from the "1440" in Visual Studio to 5a0. Here's the output from the "~" command.
 0:000> ~
.  0  Id: 1c04.15f8 Suspend: 1 Teb: 7ffdf000 Unfrozen
   1  Id: 1c04.11e8 Suspend: 1 Teb: 7ffde000 Unfrozen
   2  Id: 1c04.16cc Suspend: 1 Teb: 7ffdd000 Unfrozen
   3  Id: 1c04.d08 Suspend: 1 Teb: 7ffdc000 Unfrozen
   4  Id: 1c04.153c Suspend: 1 Teb: 7ffda000 Unfrozen
   5  Id: 1c04.1478 Suspend: 1 Teb: 7ffd7000 Unfrozen
   6  Id: 1c04.d14 Suspend: 1 Teb: 7ffd9000 Unfrozen
   7  Id: 1c04.102c Suspend: 1 Teb: 7ffd6000 Unfrozen
   8  Id: 1c04.ac0 Suspend: 1 Teb: 7ffd5000 Unfrozen
   9  Id: 1c04.1118 Suspend: 1 Teb: 7ffd4000 Unfrozen
  10  Id: 1c04.5a0 Suspend: 1 Teb: 7ffd3000 Unfrozen
  11  Id: 1c04.13d8 Suspend: 1 Teb: 7ffd8000 Unfrozen
In this list, thread 10 matches the one where we hit the breakpoint in Visual Studio -- so we can switch to this thread from thread 0 by executing "~10 s". Alternatively, if you were viewing the "Processes and Threads" window, you could just double-click on the thread in question.
5. Now we're ready to look at the stack. Execute the command "!clrstack". The output should closely resemble the stack trace that you see in Visual Studio -- except now you'll see names for all of those "Lightweight Function" frames. You'll also get the stack pointer and instruction pointer for each frame. The result should look something like this:
 0:010> !clrstack
OS Thread Id: 0x66c (10)
ESP       EIP
0572da10 04f85469 IronPython.Modules.PythonNT.chdir(System.String)
0572da80 04a81b99 DynamicClass._stub_$11##11(System.Runtime.CompilerServices.Closure, System.Scripting.Actions.CallSite, System.Scripting.Runtime.CodeContext, System.Object, System.String)
0572dab8 04a81ab1 DynamicClass._stub_MatchCaller(System.Object, System.Scripting.Actions.CallSite, System.Object[])
0572dae4 047fa24d System.Scripting.Actions.CallSite`1[[System.__Canon, mscorlib]].UpdateAndExecute(System.Object[])
0572dc68 04f60307 System.Scripting.Actions.UpdateDelegates.Update3[[System.__Canon, mscorlib],[System.__Canon, mscorlib],[System.__Canon, mscorlib],[System.__Canon, mscorlib],[System.__Canon, mscorlib]](System.Scripting.Actions.CallSite, System.__Canon, System.__Canon, System.__Canon)
0572dce8 04a81925 DynamicClass.<module>$10##10(System.Runtime.CompilerServices.Closure, System.Scripting.Runtime.Scope, System.Scripting.Runtime.LanguageContext)
0572dd88 04a74ab8 System.Scripting.ScriptCode.InvokeTarget(System.Linq.Expressions.LambdaExpression, System.Scripting.Runtime.Scope)
6. That second-from-top entry looks intriguing. How can we see its code? The first thing we need to do is to get a method descriptor for it, which we can do using the SOS command !ipmd.
 0:010> !ip2md 04a81b99
MethodDesc: 047ee580
Method Name: DynamicClass._stub_$11##11(System.Runtime.CompilerServices.Closure, System.Scripting.Actions.CallSite, System.Scripting.Runtime.CodeContext, System.Object, System.String)
Class: 047ee2c0
MethodTable: 047ee324
mdToken: 06000000
Module: 047e6b48
IsJitted: yes
CodeAddr: 04a81b18
With the method descriptor, the !dumpil command will show us the actual MSIL for this method.
 0:010> !dumpil 047ee580
This is dynamic IL. Exception info is not reported at this time.
If a token is unresolved, run "!do <addr>" on the addr given
in parenthesis. You can also look at the token table yourself, by
running "!DumpArray 01eb82ec".
IL_0000: ldarg.3
IL_0001: ldarg.0
IL_0002: ldfld 4000002 (01eb7c4c)
IL_0007: ldc.i4.0
IL_0008: ldelem.ref
IL_0009: castclass 2000003 "System.WeakReference"
IL_000e: callvirt 6000004 System.WeakReference.get_Target()
IL_0013: ceq
IL_0015: brfalse IL_0023
IL_001a: ldarg.s VAR OR ARG 4
IL_001c: call 6000005 IronPython.Modules.PythonNT.chdir(System.String)
IL_0021: ldnull
IL_0022: ret
IL_0023: ldarg.1
IL_0024: castclass 2000006 "System.Scripting.Actions.CallSite`1[[System.Scripting.Actions.DynamicSiteTarget`4[[System.Scripting.Runtime.CodeContext, Microsoft.Scripting.Core],[System.Object, mscorlib],[System.String, mscorlib],[System.Object, mscorlib]], Microsoft.Scripting.Core]]"
IL_0029: ldfld 4000007 (01eb8120)
IL_002e: ldarg.1
IL_002f: ldarg.2
IL_0030: ldarg.3
IL_0031: ldarg.s VAR OR ARG 4
IL_0033: callvirt 6000008 System.Scripting.Actions.DynamicSiteTarget`4[[System.__Canon, mscorlib],[System.__Canon, mscorlib],[System.__Canon, mscorlib],[System.__Canon, mscorlib]].Invoke(System.Scripting.Actions.CallSite, System.__Canon, System.__Canon, System.__Canon)
IL_0038: ret
IL_0039: ldnull
IL_003a: ret
If you want to see what the associated x86 or x64 machine code looks like, the "CodeAddr" value from the !ip2md command will give you the starting address of the JITted code. You can use this with the windbg "u" command (for "unassemble").
7. Once you're done, be sure to detach windbg from the program you're looking at; it's quite likely that Visual Studio will be hung until you do. That's because it will be waiting to get data back from the debug thread that was injected into the target process -- but windbg has suspended that thread on your behalf. "Detach Debuggee" is a menu choice on the "Debug" menu.
Left as an Exercise to the Reader
One of the interesting things that's possible with cdb.exe -- the command-line version of windbg.exe -- is to control it from a separate program. All of the functionality we used above is accessible through cdb. You can therefore write a program that starts a separate cdb process, piping commands to its standard input and reading -- and parsing -- the results from its standard output. You could even write a GUI that shows the stack of the target process, and when the user clicks on a frame it puts up the MSIL for that frame into one pane and the assembly code into another.
Write it using IronPython.