Performance Counters in Excel Services - what do they mean
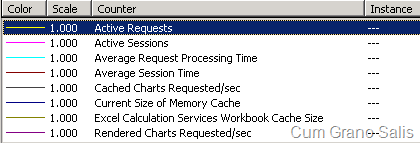
Excel Services comes with a few performance counters designed to let an administrator know the load under which Excel Services is operating. When all performance counters are added, the list inside the management console looks like this:
- Active Requests: This is the number of requests Excel Services is currently servicing. This number does not include requests that are queued in IIS or ASP.NET. Almost any request that Excel Services looks at will be accounted for here. The only cases where they are not is when the request is malformed in one way or another - in these cases it will be rejected before it's counted (and thus will not show).
- Active Sessions: This corresponds to the amount of sessions that are currently opened in Excel Services. Whenever a user starts communicating with Excel Services, a session is created (this will increase this counter). Whenever a session times out or gets explicitly closed, this number will decrease by one. A very large number (1000s) that never goes down probably indicates an issue with the server (it really depends on usage pattern, on how strong the machine is, etc). Note: When explicitly closing a workbook, the number may not fall immediately. It may take the performance counter up to 5 seconds to actually reflect the fact that the session has been closed.
- Average Request Processing Time: This number represents the average amount of time Excel Services has taken to process each request. A high number here (in the 10s of seconds) on a server probably indicates some issue.
- Average Session Time: This indicates the average life-time of sessions in the system. This number is really dependant on usage patterns - if users in the org tend to analyze and work with workbooks for a long time, then this number can reach quite high. If users tend to just look at dashboard information, it will probably be equal to the average Short Session Timeout value of the Trusted Locations used.
- Rendered Charts Requested/sec and Cached Charts Requested/sec: Whenever a user requests a chart from Excel Services (for example, by viewing an area in a workbook that contains a chart), Excel Services needs to look at the data and generate the chart image. Since this is a relatively expensive operation, the chart is then stored on disk. The "Rendered Charts" counter specifies how many times per second Excel Services actually went ahead and generated a chart image from data. The second number ("Cached Charts") specifies how many times a second an already-prepared chart was used.
- Current size of memory cache: This is probably one of the least useful and more confusing performance counter for Excel Services. It contains the value of certain types of memory allocations. The problem is that for performance reasons, the number does not contain all allocation originating from the various sub-systems of Excel Services and as such is not very useful.
- Excel Calculation Services Workbook Cache Size : This over-long name corresponds to the amount of bytes taken on disk for caching workbooks. When a workbook is first opened on the server, it is fetched from the source (SharePoint, UNC etc) and placed on the hard-drive of the Excel Services machine - this perf counter shows how much disk space these workbooks occupy.