A couple IDE tips
1. Set Breakpoint using the Find Combo Box
You can use the breakpoint dialog to set a breakpoint. But if you feel that’s too slow for you, use the Find Combo Box which is on the toolbar and next to Find in Files.
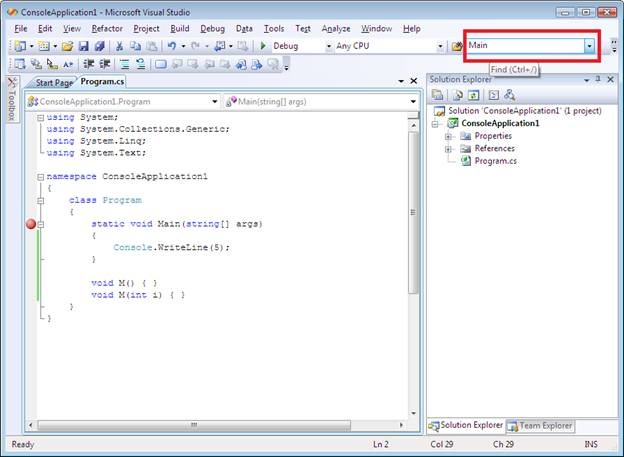
In the Find Combo Box, type in the function name, e.g. Main as indicated in the above figure, and then hit F9. You will notice a breakpoint is set on function Main.
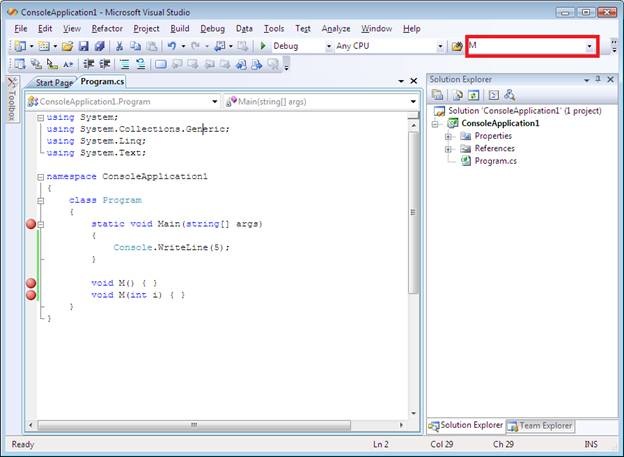
Overloaded methods are supported as well. In the following figure, we have two overloaded methods M. Type in the function name M in the Find Combo Box and then hit F9, we can see breakpoint is set on both of the methods M.
2. A little bit more fun with the Find Combo Box
You can open project files from the Find Combo Box. There are multiple ways to do that. For example, if you want to open file foo.cs:
· Type in the filename foo.cs and press CTRL+SHIFT+G
· Enter “>open foo.cs”
· Enter “>of foo.cs”
3. Threads Window
When you are doing multithread debugging on multiple CPU systems, it can be problematic especially when single stepping. When this happens, you might want to freeze some threads so they don’t execute. You can do this by opening the threads window and right click on the thread and select Freeze from the context menu. Be careful as you might mess up you application.