
Sales Pipeline Report
We used to have a long list of reports in MSCRM version 1.2. For MSCRM version 3.0 (v3), when we moved to SQL Reporting Services (SRS), many of these reports were consolidated and the number of reports that v3 shipped with was dramatically reduced. One of the reports became a consolidated version of many old reports – the Sales Pipeline Report. Though we lost the pretty pipeline to show the sales pipeline report when we moved away from Crystal Reports, we also incorporated interesting functionality using the power of SRS into this report. I’ve seen a few messages on the newsgroups asking about what happened to the old sales report where people could see the sales by each user etc. So here’s how one may slice and dice this report to view the sales pipeline of an organization.
There are multiple grouping areas on the report:
Group By Sales Process – this will show the Sales Processes that are active and have at least one opportunity with that sales process running on it. The opportunities that do not have a sales process running on them will be displayed under the “None” bucket.
Group By – The options here are:
-
- Sales User – This groups the Sales Pipeline by a user. So on the X-axis of the graph, one would see a list of sales users and on the Y-axis will be the revenue. The next grouping (Revenue) explains how the revenue is calculated. Drilling down into the detailed report (by clicking on the individual bar in the bar chart) would display a detailed opportunities list that combines to make up the total revenue for the user. Clicking on the line items of this detailed report would open the actual opportunity. If any changes are made to the opportunity, refreshing the report will update the report to incorporate these changes. Each drill down detailed report displays the opportunity name, sales stage, probability to close, revenue (calculated based on the “Revenue” selection as explained below) and the owner. This is true for all the detailed reports mentioned below.
-
- Sales Territory – This would become useful if the salespeople are organized by Sales Territories. In that case this would enable the sales managers/VPs to see the pipeline based on the territories. Since each sales user can have one territory, this report would group the revenues of those sales people together to give a consolidated territories view. Drilling down into the detailed report shows the opportunities grouped by sales territories.
-
- Customer Territory – This would become useful if the opportunities have potential customers that already are “Accounts” in CRM and those accounts have Territories defined on them (Territories can be specified only for accounts in the “Details” tab of an account). Each bar is also a drill down detailed report that can be opened by clicking on the bar.
-
- Date – This displays the sales pipeline report by the estimated close date of the opportunities. Each bar is a drilled down detailed report.
-
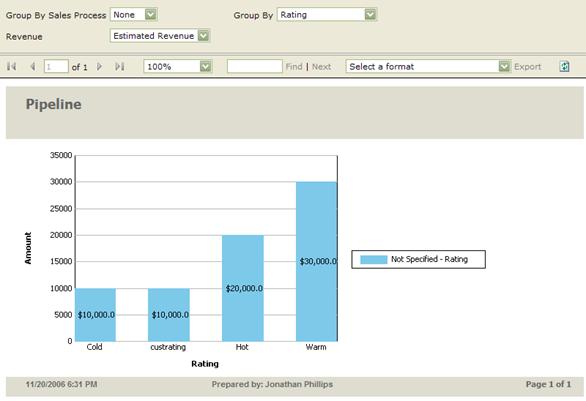
- Rating – This displays the sales pipeline report based on the rating of the opportunity. Opportunity ratings are customizable through the Customization area. If the ratings are customized, the new (customized) names would show up in this report. Each bar is also a drill down detailed report.
- Sales Stage – Sales stage grouped report would be useful if the opportunities have Sales Processes defined on them and the “Grouped by sales process” has a sales process selected. In that case, the report will display the opportunity grouping based on the sales stages of the selected sales process. Each bar is also a drill down detailed report.
Revenue – The options here are
-
- Estimated Revenue – This is the revenue that is displayed on the Opportunity detail form as the revenue amount. The revenue may either be calculated or user provided. When this option is selected, all the drill down detailed reports (mentioned above in the “Group by” area) and the bar chart y-axes will display the Estimated Revenue amount.
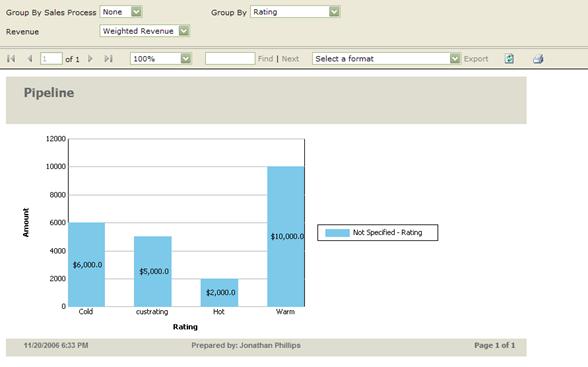
- Weighted Revenue – This is calculated as [(Estimated Revenue * Probability to Close)/100]. When this option is selected, all the drill down detailed reports and the bar chart y-axes will display the Weighted Revenue amount.
Here are two sample screenshots
Grouped by Rating and using Estimated revenue:
Same set of opportunities Grouped by Weighted Revenue
Overall, the sales pipeline report is a complex report that could help slice and dice your data in different ways. There may be some reasons why this report works or doesn’t work for you and I’d love to hear them.