Performance: Inserting Marks Using Code
Ian previously covered using the VS 2008 Data Collection Control to choose when to collect data. The Data Collection Control can also be used to insert marks into the performance report, but sometimes it is convenient to modify the source code to do this automatically.
Consider a typical application (PeopleTrax) where I am interested in gathering profiler data only between when a button is clicked and when data is displayed. The application is shown below.
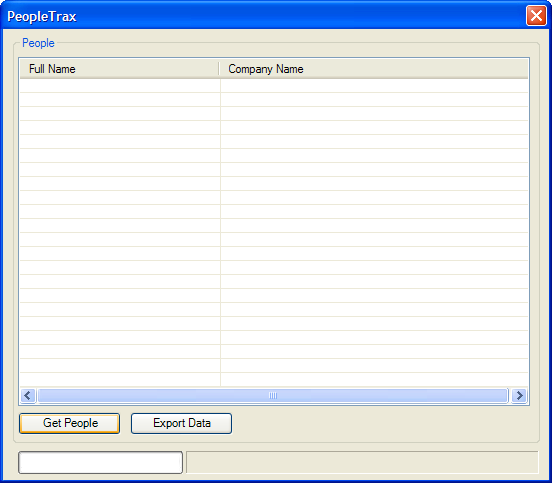
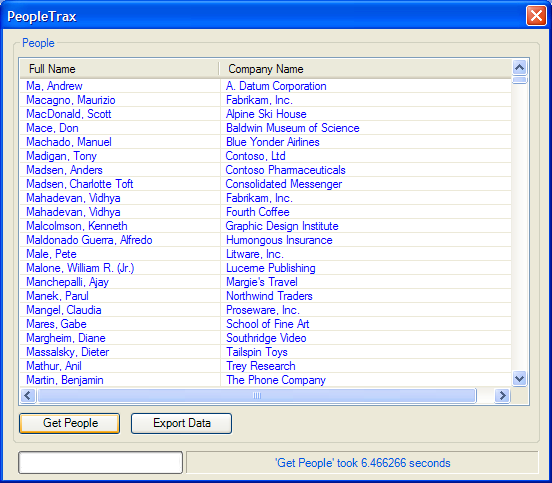
After the 'Get People' button is clicked, data is displayed after just over 6 seconds. This seems a little excessive so I want to focus my performance investigation in this area.
To filter the data so that it only shows information collected between those two points, I could use the Data Collection Control, but maybe I'm planning to run a complicated scenario and don't want to have to remember to insert the marks manually. Instead, it is possible to modify the original code to request the profiler insert marks in the required locations.
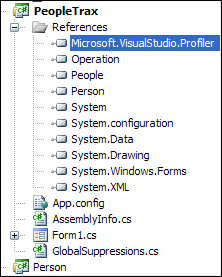
The Profiler API is available for managed code in an assembly that can be added directly to the project from \Program Files\Microsoft Visual Studio 9.0\Team Tools\Performance Tools.
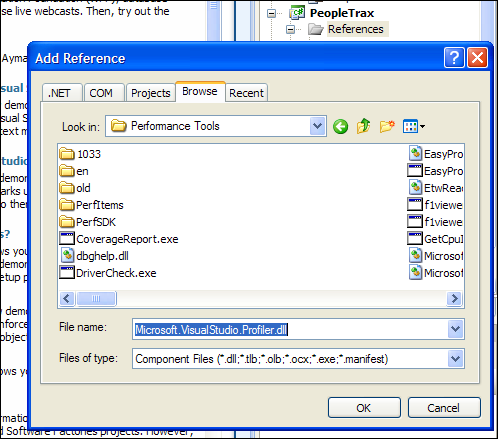
After adding the reference it shows up in the 'References' list for the PeopleTrax project.
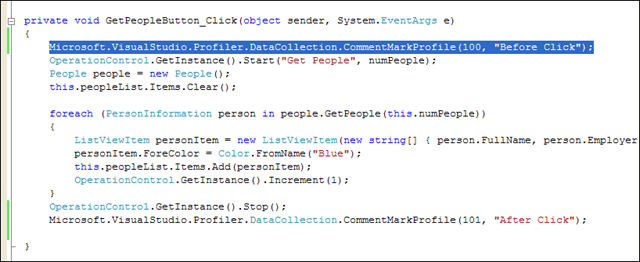
I can then use functions in the Profiler API to control the profiler. This might include starting or stopping data collection or in this case, inserting marks into the datastream. This is easily achieved as shown below.
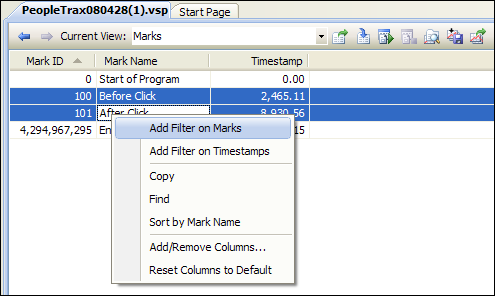
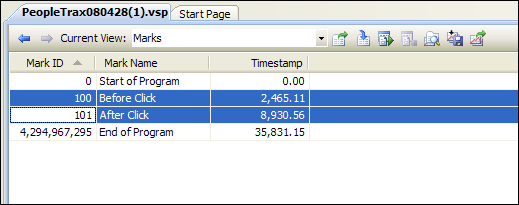
I can then profile the application and when I open the Performance Report and switch to Marks View I see that the marks have been correctly inserted. We can also see that the time elapsed between the marks is about 6.5 seconds, which corresponds with the measurement that is already displayed in the PeopleTrax UI.
I can use the marks to filter the report to only show profiling data for the time between the two inserted marks and then start my performance investigation.