Noise Reduction in the VS2008 Profiler
One of the new profiler features in Visual Studio Team System (VS2008) is called Noise Reduction. This feature is intended to make it easier to review the Call Tree view by reducing the amount of data that is displayed, while still showing the most important functions.
To illustrate this new feature I wrote a very simple native C++ application that utilizes TR1 in the Feature Pack Beta. In this simple app I create some shared_ptrs in a for loop after calling a recursive function a few times. If you're not familiar with TR1 take a look at the VC blog for more information.
1: #include <tchar.h>
2: #include <memory>
3:
4: class A
5: {
6: public:
7: A(int v, int w) : b(v), c(w)
8: {}
9: private:
10: int b;
11: int c;
12: };
13:
14: void recurse(int v)
15: {
16: if (v > 0)
17: {
18: recurse(--v);
19: }
20: else
21: {
22: A someA(1,2);
23: for (int i=0; i < 100; ++i)
24: {
25: std::tr1::shared_ptr<int> a(new int(2));
26: std::tr1::shared_ptr<A> b(new A(2,3));
27: std::tr1::shared_ptr<A> c(b);
28: }
29: }
30: }
31:
32: int _tmain(int argc, _TCHAR* argv[])
33: {
34: recurse(5);
35: return 0;
36: }
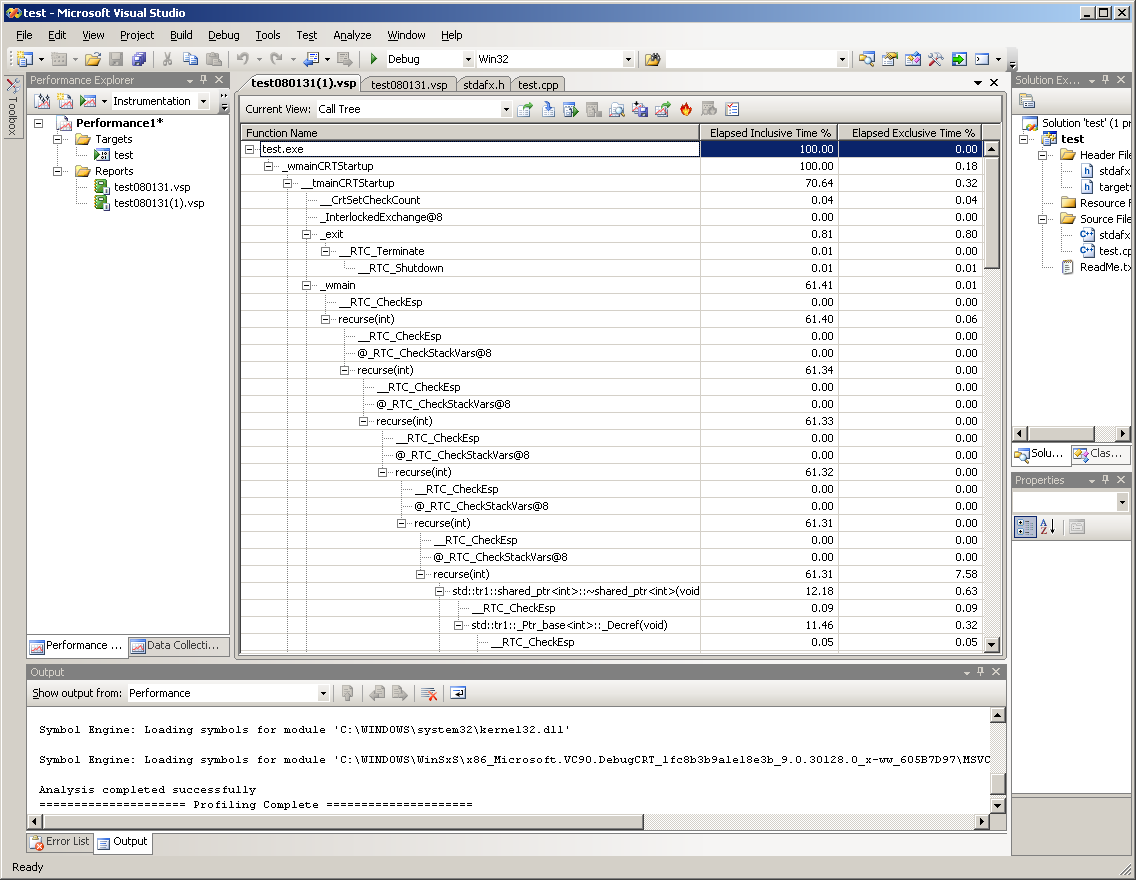
I profiled the application using Instrumentation Mode as shown below. Shifting to 'Call Tree' view and expanding I see my main function, which calls recurse 6 times (the initial call from main plus 5 recursive calls from inside the if statement in recurse). There are also a lot of other calls that have very little inclusive time (e.g. __RTC_CheckESP).
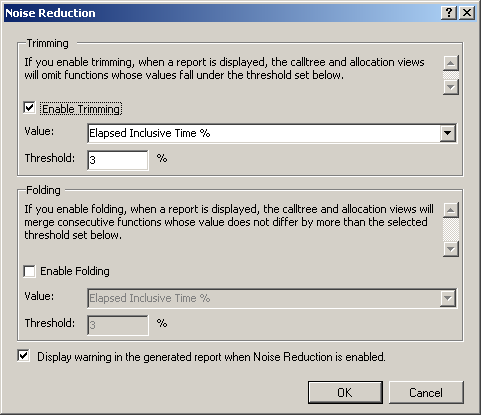
To reduce the noise in the call tree I choose to enable noise reduction by clicking on the icon on the far right of the toolbar (it looks like a checklist). In the dialog I enable trimming, using a threshold of 3%.
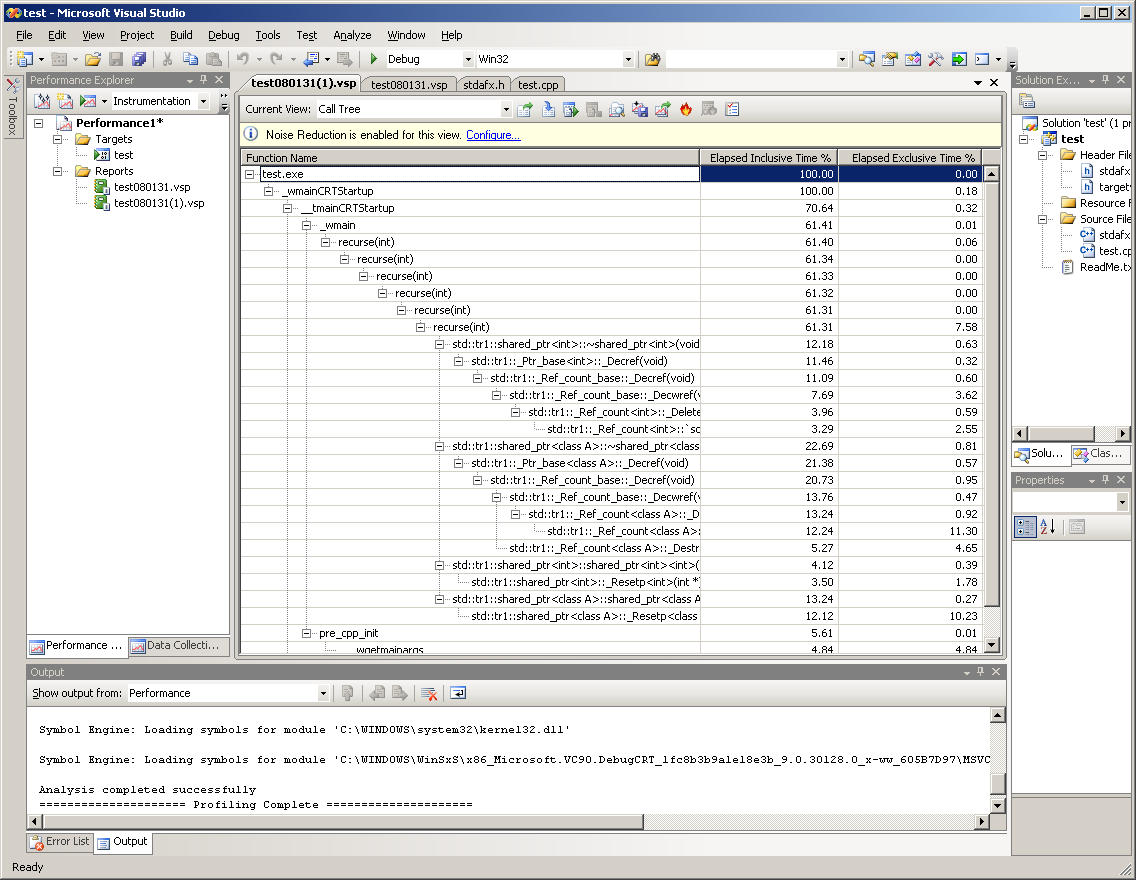
After enabling this option I expand the call tree again and many of the extra calls are gone and the calls to recurse are much easier to see as shown below.
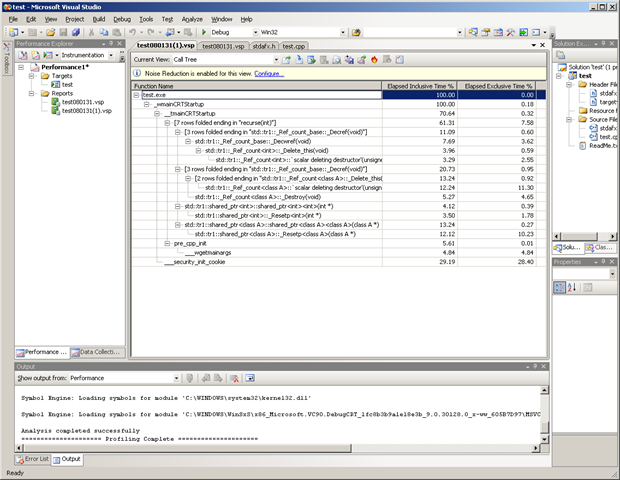
I still think I can do a little better so I open up the Noise Reduction dialog again and 'Enable Folding'.
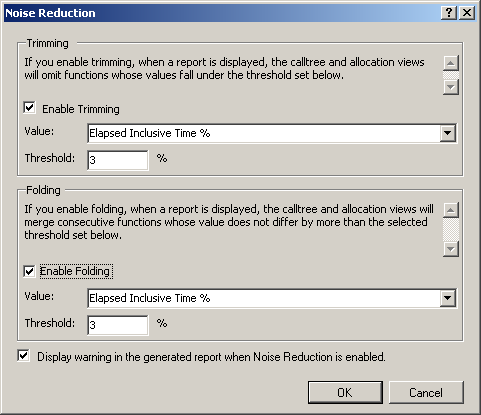
The resulting call tree can now be completely expanded and shown without scroll bars. I can see that functions that have significant exclusive time include: __security_init_cookie (28.40%), shared_ptr setup for A, (10.23%), shared_ptr refcount destructor (11.30%) & the last call to recurse (7.58%).
Using Noise Reduction in a larger application should make it easier for you to find performance problems.
Details:
- Trimming removes leaf nodes in the call tree that have Elapsed Inclusive Time % (or Inclusive Sample % if you use sampling mode) lower than the threshold.
- Folding combines (folds) a child node up to its parent node if it is the only child and the Elapsed Inclusive Time % (or Inclusive Sample % if you use sampling mode) is within Threshold of its parent. The intention is to fold simple forwarding functions that don't have much influence on the performance of your code.
Trimming is applied first and then folding, which is why the calls to recurse are all folded.