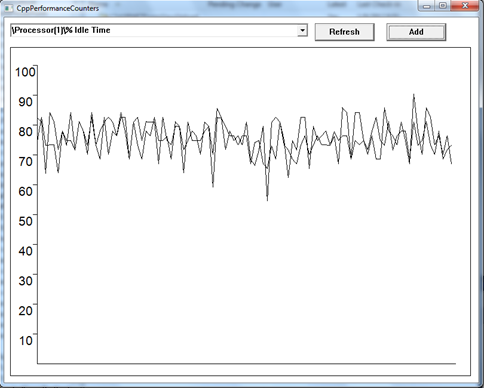
[Sample of Mar 13th] Track the system CPU usage
 |
 |
|
 |
 |
|
Sample Downloads
C# version: https://code.msdn.microsoft.com/CSCpuUsage-f009d9c1
VB version: https://code.msdn.microsoft.com/VBCpuUsage-be7e2c94
C++ version: https://code.msdn.microsoft.com/Track-the-system-CPU-usage-defc62b6
Today’s code sample demonstrates how to use the PerformanceCounter to track the CPU usage of the system or a certain process using C# or VB or native C++ code. It lets the user visualize a Plot of one or more Performance Counter Value against time.

The sample code was developed by the star sample writer: Amit Dey
 You can find more code samples that demonstrate the most typical programming scenarios by using Microsoft All-In-One Code Framework Sample Browser or Sample Browser Visual Studio extension. They give you the flexibility to search samples, download samples on demand, manage the downloaded samples in a centralized place, and automatically be notified about sample updates. If it is the first time that you hear about Microsoft All-In-One Code Framework, please watch the introduction video on Microsoft Showcase, or read the introduction on our homepage https://1code.codeplex.com/.
Introduction
This code sample demonstrates how to use the PerformanceCounter to track the CPU usage of the system or a certain process. It lets the user visualize a Plot of one or more Performance Counter Value against time.
Running the Sample
Open Solution in Visual Studio 2010
Go to “Debug” -> “Start without Debugging”
From Drop Down, Select Performance Counter of Interest.
Click “Add”
See a graph of Performance Counter value against time.
You may add more counters by Repeating Steps 3 and 4.

Using the Code
This sample code functions in following high-level steps in the C++ version of the sample. You can learn the C# and VB version by downloading the samples from the above links.
1. First List Down Valid Counter Names. For each processor a “Processor Time” and “Idle Time” performance counter is added. For each running process a “Processor Time” performance counter is added.
2. A List of “Selected” Performance Counter is maintained. It is initialized to Empty Vector. When user selects a performance counter and clicks “Add”, that counter is added to the vector.
3. A Thread runs in parallel. This Periodically, Queries each Performance Counter in the “Selected” list. The performance counters are plotted against time using GDI+.
Following are the reusable components of the Sample Code
1. Get the Processor Count of System
 DWORD GetProcessorCount()
{
    SYSTEM_INFO sysinfo;
    DWORD dwNumberOfProcessors;

    GetSystemInfo(&sysinfo);

    dwNumberOfProcessors = sysinfo.dwNumberOfProcessors;

    return dwNumberOfProcessors;
}
2. Get list of running process
 vector<PCTSTR> GetProcessNames()
{
    DWORD dwProcessID[SIZE];
    DWORD cbProcess;
    DWORD cProcessID;
    BOOL fResult = FALSE;
    DWORD index;

    HANDLE hProcess;
    HMODULE lphModule[SIZE];
    DWORD cbNeeded;
    int len;

    vector<PCTSTR> vProcessNames;

    TCHAR * szProcessName;
    TCHAR * szProcessNameWithPrefix;

    fResult = EnumProcesses(dwProcessID, sizeof(dwProcessID), &cbProcess);

    if(!fResult)
    {
        goto cleanup;
    }

    cProcessID = cbProcess / sizeof(DWORD);

    for( index = 0; index < cProcessID; index++ )
    {
        szProcessName = new TCHAR[MAX_PATH];
        hProcess = OpenProcess( PROCESS_QUERY_INFORMATION |
        PROCESS_VM_READ,
        FALSE, dwProcessID[index] );
        if( NULL != hProcess )
        {
            if ( EnumProcessModulesEx( hProcess, lphModule, sizeof(lphModule),
                &cbNeeded,LIST_MODULES_ALL) )
            {
                if( GetModuleBaseName( hProcess, lphModule[0], szProcessName,
                    MAX_PATH ) )
                {
                    len = _tcslen(szProcessName);
                    _tcscpy(szProcessName+len-4, TEXT("\0"));

                    bool fProcessExists = false;
                    int count = 0;
                    szProcessNameWithPrefix = new TCHAR[MAX_PATH];
                    _stprintf(szProcessNameWithPrefix, TEXT("%s"), szProcessName);
                    do
                    {
                        if(count>0)
                        {
                            _stprintf(szProcessNameWithPrefix,TEXT("%s#%d"),szProcessName,count);
                        }
                        fProcessExists = false;
                        for(auto it = vProcessNames.begin(); it < vProcessNames.end(); it++)
                        {
                            if(_tcscmp(*it,szProcessNameWithPrefix)==0)
                            {
                                fProcessExists = true;
                                break;
                            }
                        }
                        count++;
                    }
                    while(fProcessExists);

                    vProcessNames.push_back(szProcessNameWithPrefix);
                }
            }
        }
    }

cleanup:
    szProcessName = NULL;
    szProcessNameWithPrefix = NULL;
    return vProcessNames;
}
3. Get list of valid Performance Counter Names
 vector<PCTSTR> GetValidCounterNames()
{
    vector<PCTSTR> validCounterNames;
    DWORD dwNumberOfProcessors = GetProcessorCount();
    DWORD index;
    vector<PCTSTR> vszProcessNames;
    TCHAR * szCounterName;

    validCounterNames.push_back(TEXT("\\Processor(_Total)\\% Processor Time"));
    validCounterNames.push_back(TEXT("\\Processor(_Total)\\% Idle Time"));

    for( index = 0; index < dwNumberOfProcessors; index++ )
    {
        szCounterName = new TCHAR[MAX_PATH];
        _stprintf(szCounterName, TEXT("\\Processor(%u)\\%% Processor Time"),index);
        validCounterNames.push_back(szCounterName);
        szCounterName = new TCHAR[MAX_PATH];
        _stprintf(szCounterName, TEXT("\\Processor(%u)\\%% Idle Time"),index);
        validCounterNames.push_back(szCounterName);
    }

    vszProcessNames = GetProcessNames();

    for(auto element = vszProcessNames.begin();
        element < vszProcessNames.end();
        element++ )
    {
        szCounterName = new TCHAR[MAX_PATH];
        _stprintf(szCounterName, TEXT("\\Process(%s)\\%% Processor Time"),*element);
        validCounterNames.push_back(szCounterName);
    }

cleanup:
    szCounterName = NULL;
    return validCounterNames;
}
4. class Query: For querying Performance Counters
a) Adds a Performance Counter to Log.
 void Query::AddCounterInfo(PCWSTR name)
{
    if(fIsWorking)
    {
        PDH_STATUS status;
        CounterInfo ci;
        ci.counterName = name;
        status = PdhAddCounter(query, ci.counterName, 0 , &ci.counter);

        if(status != ERROR_SUCCESS)
        {
            return;
        }

        vciSelectedCounters.push_back(ci);
    }
}
b) Query once for each Selected Performance Counter.
 void Query::Record()
{
    PDH_STATUS status;
    ULONG CounterType;
    ULONG WaitResult;
    PDH_FMT_COUNTERVALUE DisplayValue;

    status = PdhCollectQueryData(query);

    if(status != ERROR_SUCCESS)
    {
        return;
    }

    status = PdhCollectQueryDataEx(query, SAMPLE_INTERVAL, Event);

    if(status != ERROR_SUCCESS)
    {
        return;
    }

    WaitResult = WaitForSingleObject(Event, INFINITE);

    if (WaitResult == WAIT_OBJECT_0)
    {
        for(auto it = vciSelectedCounters.begin(); it < vciSelectedCounters.end(); it++)
        {
            status = PdhGetFormattedCounterValue(it->counter, PDH_FMT_DOUBLE, &CounterType, &DisplayValue);

            if(status != ERROR_SUCCESS)
            {
                continue;
            }

            Log log;
            log.time = time;
            log.value = DisplayValue.doubleValue;
            it->logs.push_back(log);
        }
    }

    time++;
}