Extracting Information from Crash and Hang Dumps
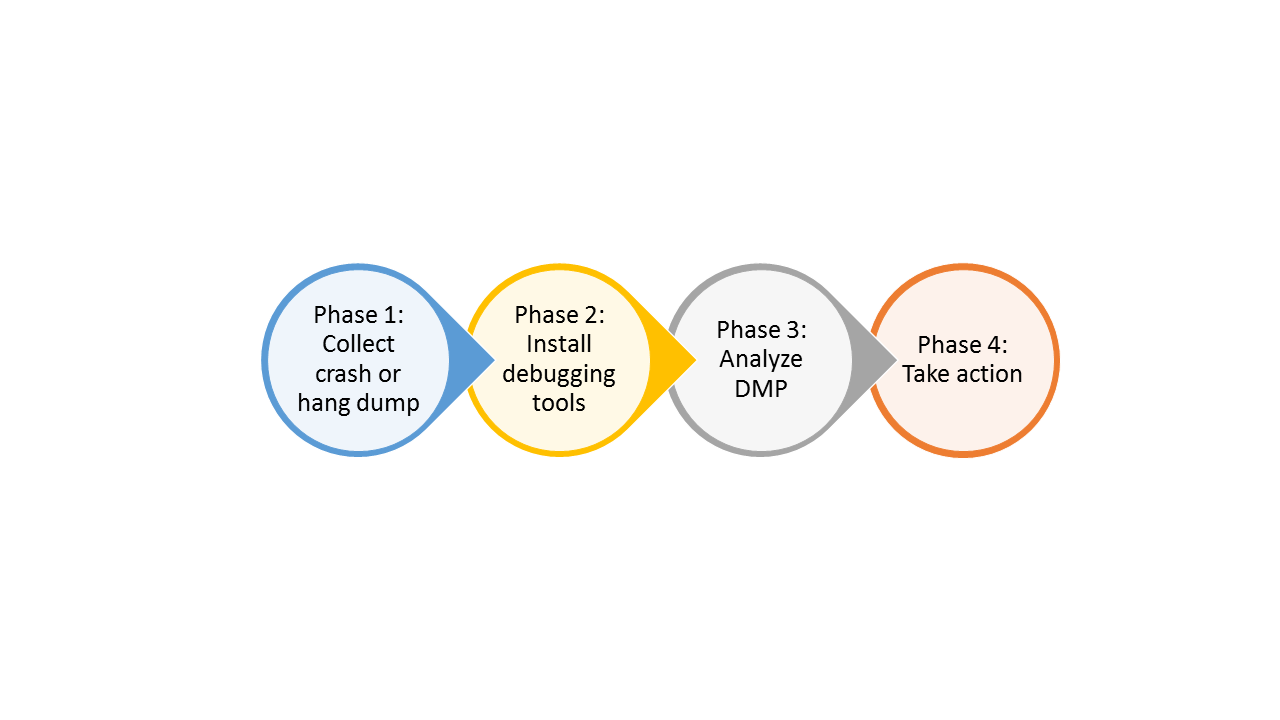
In order to understand the causes for crashes and hangs, specific information needs to be collected and analyzed. This article describes the four phases of this process.
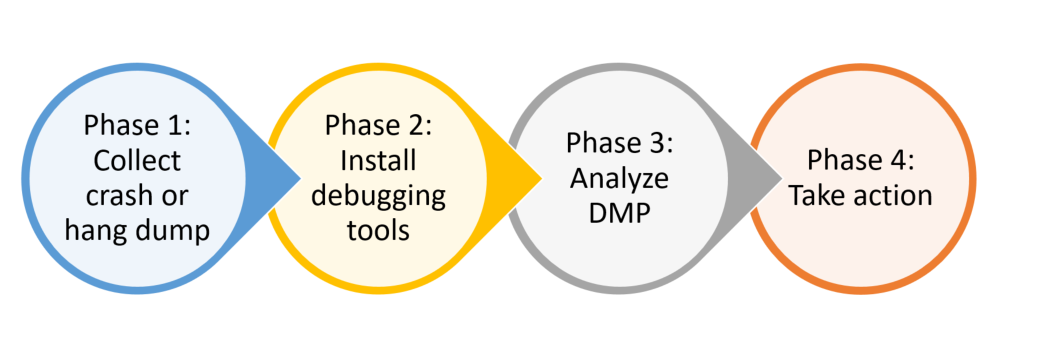
Phase 1: Collect crash or hang dump
There are multiple ways to achieve this, please check this blog post for details.
Phase 2: Install debugging tools
- Download the Windows 10 SDK from: https://developer.microsoft.com/en-us/windows/downloads/windows-10-sdk
- Please note that this SDK works for all Windows versions starting Windows Server 2008, not only for Windows 10.
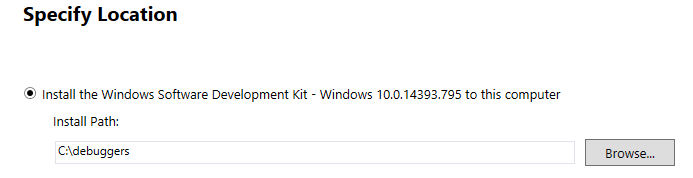
- Run the installer
- At first step, specify an easily accessible location, since we'll need to work from the Command Prompt
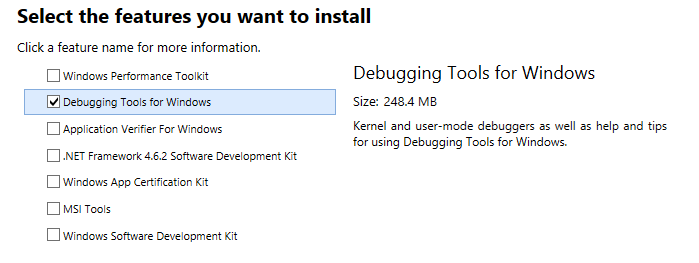
- At the step that asks for features to install, select only "Debugging Tools for Windows"
- Optional: Set symbol path. Debugging symbols are files generated at compile time which link variable and method addresses to names. By default, the debugger downloads symbols from the Microsoft public symbols server. To cache symbols locally, you may specify a System Environment Variable: _NT_SYMBOL_PATH=srv*c:\Symbols*https://msdl.microsoft.com/download/symbols. More information here: https://msdn.microsoft.com/en-us/library/windows/hardware/ff552208(v=vs.85).aspx
Phase 3: Analyze DMP
The questions that crash / hang dump analysis needs to answer are:
- What is the crashing signature?
- What is the call stack?
The general rule of thumb is that one crashing signature and call stack identify one problem. In other words, if an application crashes with two or more different signatures, it's very likely that the application has two or more different defects and resolving only one will not prevent all crashes.
The tool we'll be using for analysing DMP files is WinDBG. CDB, which comes as part of the same package, Debugging Tools for Windows, has similar functionality but is designed to be used from the command line. The instructions below apply to AOS as well as Client dump files.
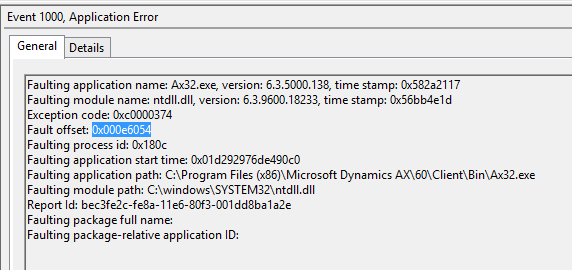
The crashing signature includes the following elements:
- Faulting process / application name
- Faulting module
- Faulting offset
- Exception code
We'll be using a simple Job (see job_kaboom) that triggers an AX client crash.
After a crash occurs, an event 1000 should be logged to the Application event log:
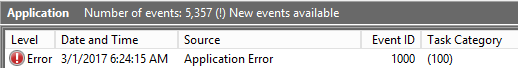
The event includes all the information for the crashing signature:
To open a crash dump in WinDBG:
- Run WinDBG. Should be located under: C:\debuggers\Debuggers\x64\windbg.exe
- File - Open Crash Dump…
- Search for the DMP file stored during Phase 1 - collection
- Now the DMP file is loaded in WinDBG and commands can be executed to perform the analysis
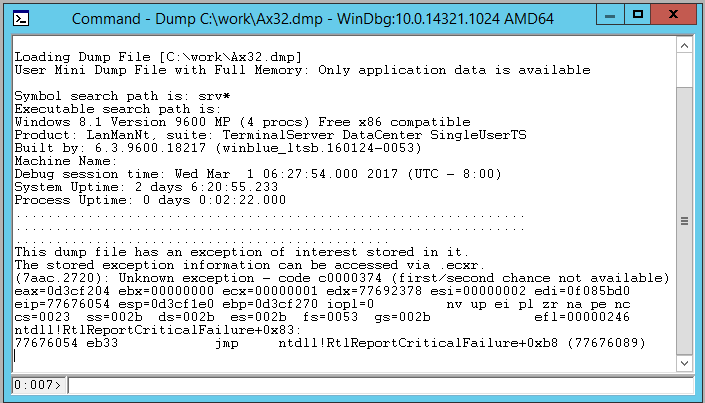
Analysis - crash signature and call stack from DMP
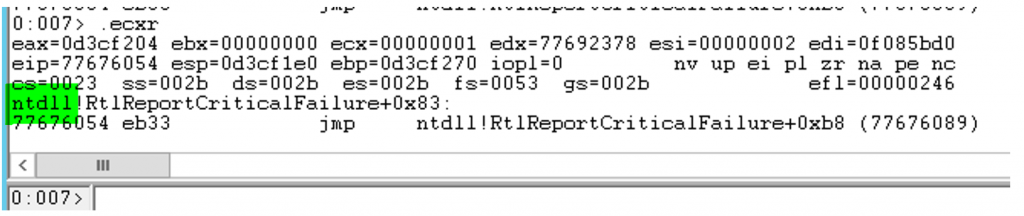
- Find the faulting module. It should be shown as the penultimate line in the command window. Running the .ecxr command also displays it. In this example, the faulting module is ntdll
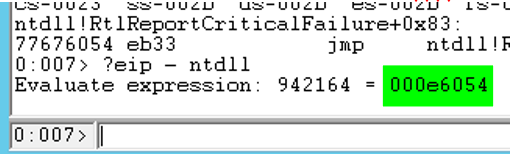
- Find the faulting offset: ?eip - <faulting module name>
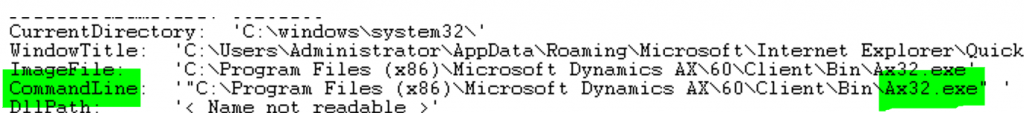
- Find the faulting process and its command line: !peb
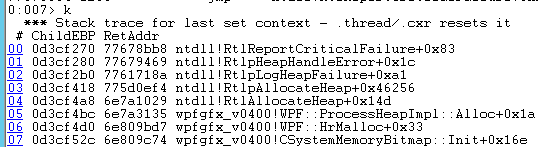
- Find the call stack that leads to the crash: k
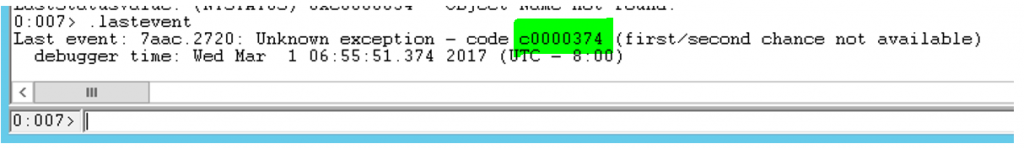
- Find the exception code: .lastevent
- Please refer to this post, which explains how to retrieve the X++ call stack.


An easier way of getting all this information and much more is the extension command:
!analyze -v
More information about each of these commands, as well as their more advanced parameters can be found in the WinDBG help section: Help - Search.
Phase 4. Take action
Once we know how to extract information from a crash dump, there are multiple courses of action.
1. Determine frequency of particular crash
By filtering the event log for event 1000 and checking the crashing signatures, you can see if the process crashes with the same signature every time (i.e. are we dealing with only one problem?) and how often that happens.
2. Determine if the crash is resolved
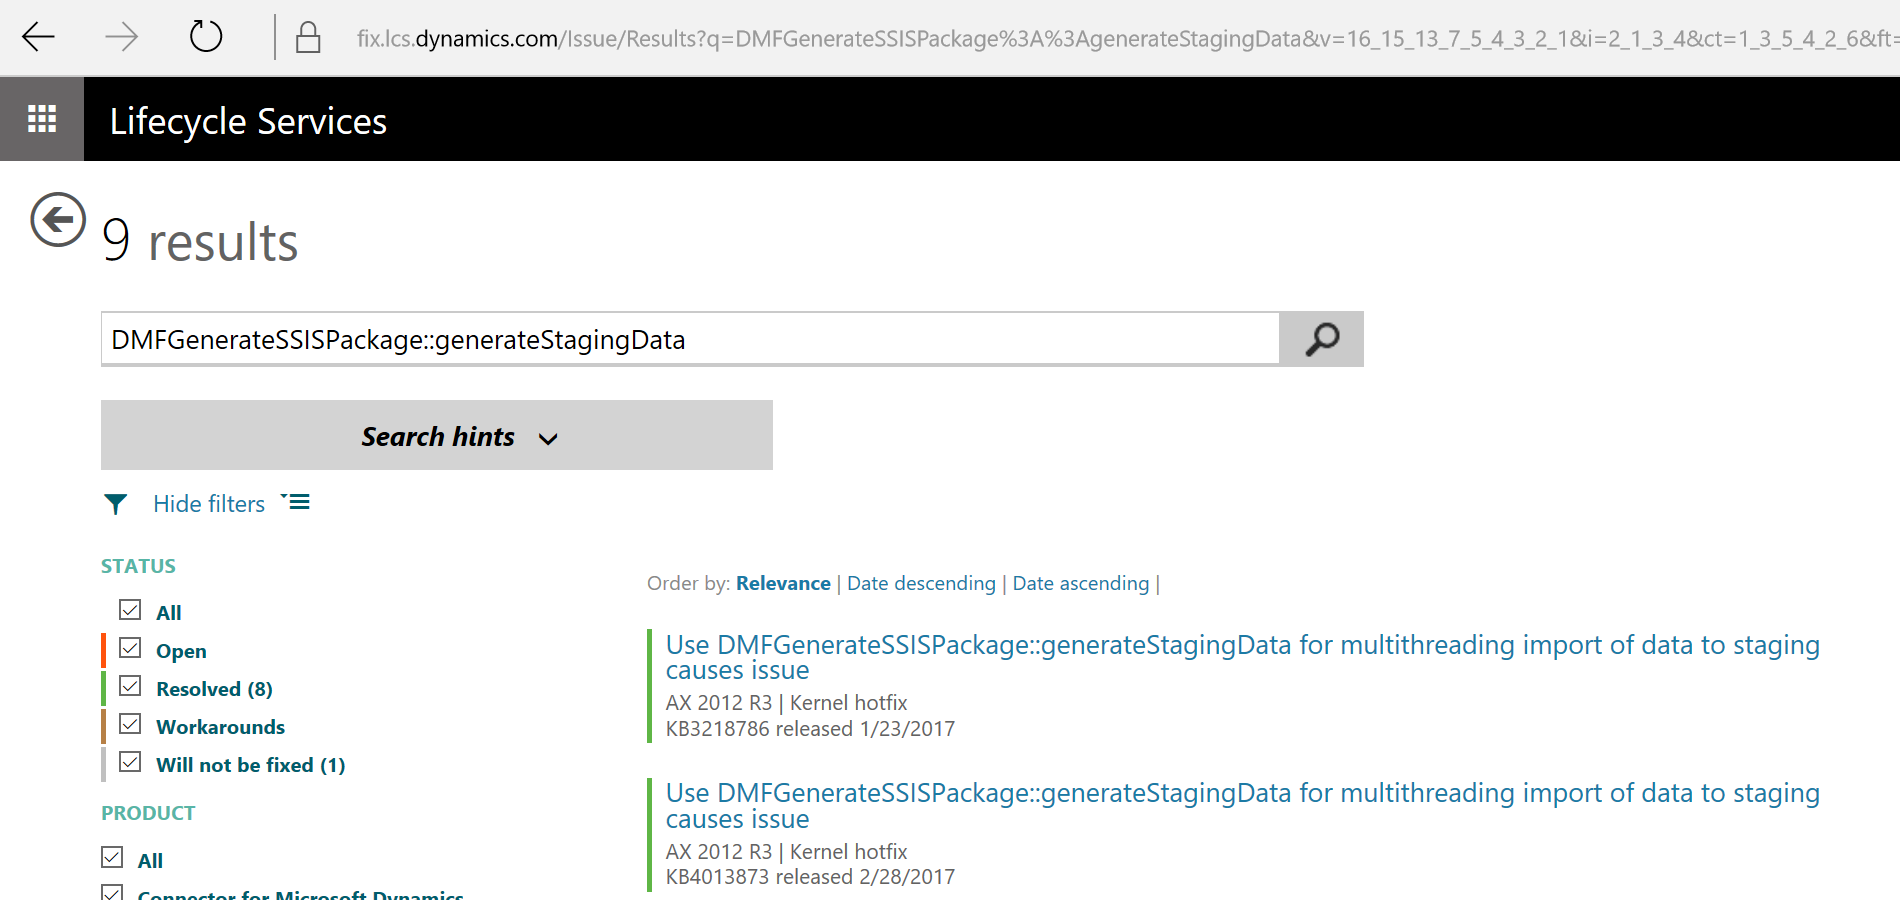
Once we know the names of the methods in the crashing call stack, we can use LCS Issue Search to see if the method is mentioned in the title or description of resolved defects. You can start with methods on the top of the call stack and move further down if no matches are found.
https://fix.lcs.dynamics.com/Issue/Results?q=DMFGenerateSSISPackage%3A%3AgenerateStagingData
It is a common practice for parts of the call stack to be included in the LCS descriptions.
3. Call Support
If Issue Search doesn't give any matches, more in-depth analysis may be required. Microsoft Support will be able to assist you further. You can easily create a new Support ticket by using the Support tile on a Microsoft Dynamics AX 2012 project dashboard in LCS and selecting "New Incident":