Collecting crash dumps
Introduction
This post discusses some basic techniques for collecting a crash dump.
To test the techniques, we’ll use an application wherein crashes can be triggered intentionally – the CrashMe application from https://windbg.info/.
In order to make this application crash one needs to press a button from the “Crash Actions” group, e.g. “Stack overflow” or “Division by NULL”. All of these buttons trigger a crash, the only difference being the exception that causes it.
The CrashMe application is useful for testing that crash collection is set up correctly on a machine without waiting for the actual real-life crash to occur.
The techniques discussed here apply to any Windows process (including the Microsoft Dynamics AX Application Object Server). This post focuses more on AX crashes.
Logging a crash
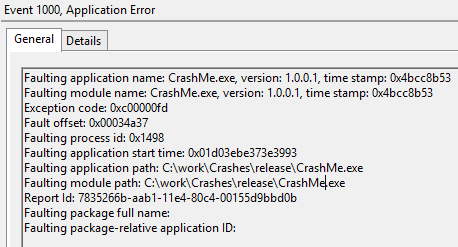
Let’s run the CrashMe application and press the “Stack overflow” button. Depending on the Windows Error Reporting settings, a dialog reporting the crash will be displayed or not. Either way, an event with the ID of 1000 will be logged in the Application section of the Windows Event Log.
The description will be similar to the one below:
Using the Windows Error Reporting mechanism
To set up the Windows Error Reporting (or WER) for dump collection, we need to create a new registry key: HKEY_LOCAL_MACHINE\SOFTWARE\Microsoft\Windows\Windows Error Reporting\LocalDumps. Under this key, we need to set at least the following two values:
- DumpFolder – REG_EXPAND_SZ – the full path to the folder where crash dumps will be stored
- DumpType – REG_DWORD – the type of crash dump. Use the value 2 for full dumps.
More details including other supported registry keys and values here.
After making these changes, and triggering a crash, a dump file will be stored in the output folder.
WER can be set up only for a specific process. To do that, a sub-key specifying the process names needs to be created under the LocalDumps key. For the CrashMe application, we need to create: HKEY_LOCAL_MACHINE\SOFTWARE\Microsoft\Windows\Windows Error Reporting\LocalDumps\CrashMe.exe\. The same two values, DumpFolder and DumpType, need to be added under this sub-key.
Using the Debug Diagnostic Tool
The Debug Diagnostic Tool (or DebugDiag) uses a more intrusive mechanism than WER for collecting crash dumps. It requires a library to be loaded inside the target process, which is why an extra step of adding a crash rule is required.
The steps to configure DebugDiag are:
1. Download the tool. The version corresponding to the architecture of the operating system needs to be chosen (either 32bit or 64 bit)
2. Run the installer. The default installation path is: C:\Program Files\DebugDiag
3. Run the DebugDiag.Collection tool
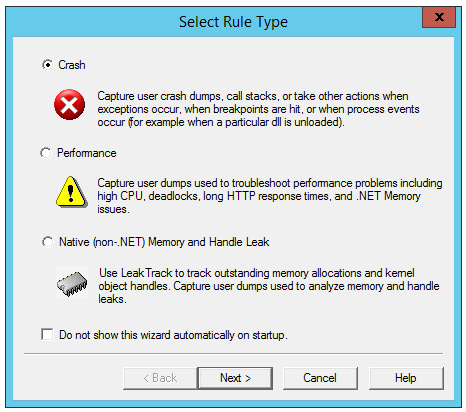
4. Select the rule type Crash and press Next:
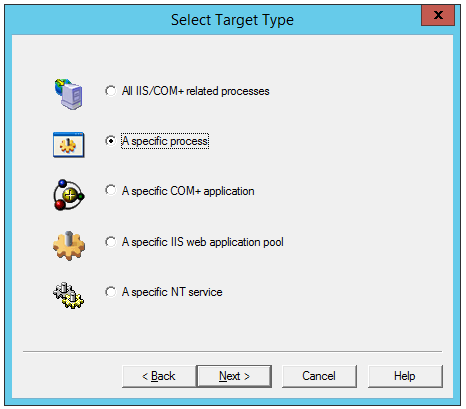
5. Select A specific process and press Next:
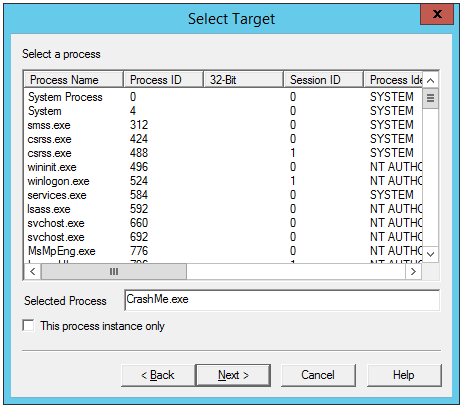
6. For processes that are not running, the name of the process can be specified in the Selected Process text box. In our example, we’ll use CrashMe.exe:
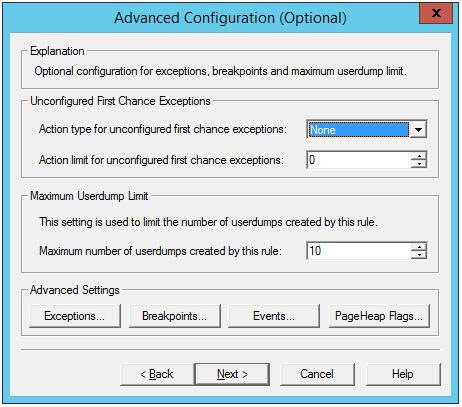
7. The next step in the wizard can be ignored for now as it allows advanced configuration, such as saving first-chance exception dumps:
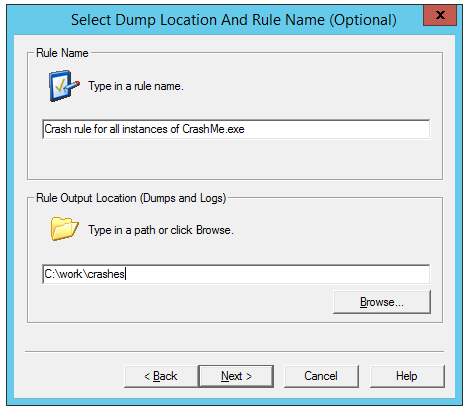
8. Provide a name for the rule and an output folder:
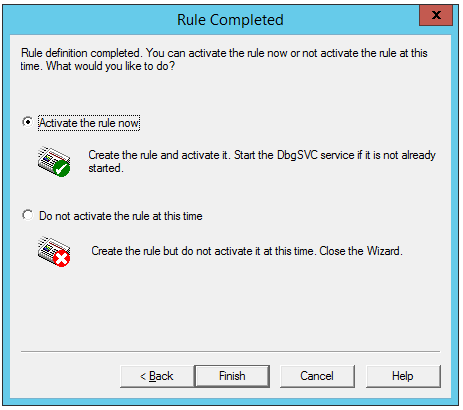
9. Activate the rule and finish the wizard:
10. Ignore the warning about symbols – you don’t need symbols for collecting crash dumps.
Now the rule is set up. Next time the application crashes, a crash dump will be saved.

By default, DebugDiag saves dumps with a relevant file name that includes the time stamp and exception code: CrashMe__PID__19576__Date__02_02_2015__Time_12_54_13AM__463__Second_Chance_Exception_C0000094
To learn more about DebugDiag please check https://blogs.msdn.com/b/debugdiag/
Using ProcDump
ProcDump is a lightweight command-line tool for collecting process dumps that can be downloaded either individually from https://technet.microsoft.com/en-us/sysinternals/dd996900.aspx or as a part of the SysInternals suite.
To use this tool:
- Download and extract the ProcDump.exe executable
- Open a Command Prompt
- Run the command: procdump.exe -ma -w CrashMe.exe –e
Here’s what the parameters mean:
- -ma = save a dump with full memory
- -w = wait for process named “CrashMe.exe” to start
- -e = collect dump on unhandled exception
The tool’s download page contains more information about other available switches.
To collect a normal process dump (e.g. for hangs), the command is:
- procdump.exe -ma 12345
Here, 12345 is the Process ID of the target process.
Using WinDBG
WinDBG can be installed as part of the Debugging tools for Windows suite, which is available under the Windows SDK.
The steps for collecting a dump using WinDBG are:
- Attach winDBG to a running process using File - Attach to a Process… or F6
- Continue the execution by running the command ‘g’ or F5
- Wait until the unhandled exception occurs. The execution of the process will be stopped and WinDBG will allow commands to be executed (this is called a debugger break)
- To collect a dump, run: .dump /mfa /u C:\work\Crashes\CrashMe.dmp
The /u switch is very useful because it appends the date, time and PID to the name of the generated dump file. The /mfa switch saves the full process memory in the dump file.