WinDBG Tutorial - Part 3
Just short piece of information about Remote Debugging.
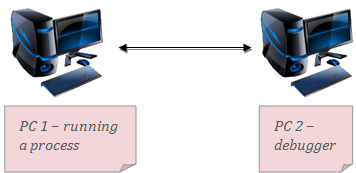
Remote Debugging actually means connecting the debugger on one computer to a process on another computer.
Typical scenario: PC 1 has a program that needs to be debugged. PC 2 does the debugging.
Advantages:
- PC 1 might not have symbols and sources for debugging (e.g. PC 1 is user of application, PC 2 is application vendor)
- PC 1 can be installed in a virtual machine
- PC 2 can debug kernel crashes
There are multiple ways of connecting the two PCs (which is normal, as multiple transport protocols are supported), but here is a quick-start for the most typical: via TCP/IP.
Steps:
1. Setup PC 1 as debugging Server:
If the WinDBG is already started on PC 1, open the Command window and write:
.server tcp:port=4001
If WinDBG is not opened, start it from the command prompt with the options:
\:>Windbg.exe -server tcp:port=4001
2. Connect PC 2 to PC 1:
Open WinDBG from command prompt with arguments:
\:>Windbg.exe windbg.exe -remote tcp:server=\\157.58.253.236,port=4001
Note: The value written in red are only examples. The IP address has to be the one of PC 1 and the port should be one of the free ports of PC 1.
3. Attach the debugger on PC 1 to a process, open a Dump or whatever. When a debugger is attached on PC 1, PC 2 will be able to debug that process as if it were a local process.
This is only one of the numerous ways of doing remote debugging. There is always the Help -> Search option in WinDBG that you can check for advanced options.