Uploading Azure NSG Flow Logs to OMS
** Edit 6/6/2017 ** The upload script has now been updated to allow for SAS token authentication in addition to using the storage account keys. Using SAS tokens allows for more granular access and reduces the risk associated with potential exposure of storage account keys. I've updated the upload command below to indicate how to run with a SAS token.
** Edit 5/4/2017 ** I mentioned below that Network Watcher is only available in 3 regions. As of May 4, 2017 Azure Network Watcher is now available in ALL public cloud regions!
Azure Network Security Group (NSG) Flow Logs were part of the recent announcement for the availability of the Azure Network Watcher service. This really cool feature allows you to collect detailed information on inbound and outbound traffic through network security groups within Azure virtual networks. This includes the source and destination IP, port, protocol, as well as whether the request was allowed or denied. These logs are written to JSON formatted files in a storage account, where they can be further analyzed by tools to glean more information from them. I've had customers express interest in this new feature, as well as the ability to pull these logs into a log aggregation tool for further data analysis. Since customers often use OMS (Azure Log Analytics) for much of their logging on Azure, I thought it would be worth looking into how these logs might be pulled into OMS since there are currently no OMS solutions that provide this functionality. What follows is a solution leveraging a PowerShell script to process and upload NSG flow logs as a custom log type in OMS.
NSG Flow Log setup
The first thing you'll need to to get NSG Flow Logs setup and enabled. Azure Network Watcher is currently available in 3 Azure regions (West US, West Central US and North Central US) so you'll want to make sure that the NSG is in one of those regions. Follow this document to enable Network Watcher in your subscription, then follow this document to enable NSG Flow Logs on your NSG. I would recommend a lower number of retention days (1 or 2) in order to keep the script execution time at a minimum.
Once you have that all set up, you should start to see NSG Flow Logs start to land in the configured storage account. These logs will carry the following format, replacing the subscription ID, Resource Group name, NSG name, and date where applicable. Log timing is UTC, and it rolls hourly. The file name itself will always be PT1H.json, but keep in mind that this is Azure Blob Storage here, so the full string is actually the name of the blob file.
resourceId=/SUBSCRIPTIONS/xxxxxxxx-xxxx-xxxx-xxxx-xxxxxxxxxxxx/RESOURCEGROUPS/<ResourceGroupName>/PROVIDERS/MICROSOFT.NETWORK/NETWORKSECURITYGROUPS/<NSGName>/y=2017/m=03/d=27/h=01/m=00/PT1H.json
Inside the log you'll see a record (see example below) for each minute containing the NSG flows during that minute. These are broken out per rule, and include the time, source IP, destination IP, source port, destination port, protocol type, whether it was inbound or outbound and whether it was allowed or denied. If there were no rule hits during that minute, an empty array is listed.
 {
    "time": "2017-03-21T18:00:18.6400000Z",
    "systemId": "81c4c8ba-7256-42ac-b861-1bf8433af839",
    "category": "NetworkSecurityGroupFlowEvent",
    "resourceId": "/SUBSCRIPTIONS/xxxxxxxx-xxxx-xxxx-xxxx-xxxxxxxxxxxx/RESOURCEGROUPS/NETFLOW-TEST/PROVIDERS/MICROSOFT.NETWORK/NETWORKSECURITYGROUPS/NETFLOWVM-NSG",
    "operationName": "NetworkSecurityGroupFlowEvents",
    "properties": {
        "Version": 1,
        "flows": [
            {
                "rule": "DefaultRule_AllowInternetOutBound",
                "flows": [
                    {
                        "mac": "000D3A319AFB",
                        "flowTuples": [
                            "1490119174,10.0.17.4,13.88.145.72,57312,443,T,O,A"
                        ]
                    }
                ]
            },
            {
                "rule": "DefaultRule_DenyAllInBound",
                "flows": [
                    {
                        "mac": "000D3A319AFB",
                        "flowTuples": [
                            "1490119180,113.22.187.101,10.0.17.4,12217,23,T,I,D"
                        ]
                    }
                ]
            },
            {
                "rule": "UserRule_block80",
                "flows": []
            },
            {
                "rule": "UserRule_default-allow-rdp",
                "flows": [
                    {
                        "mac": "000D3A319AFB",
                        "flowTuples": [
                            "1490119159,40.127.98.148,10.0.17.4,49833,3389,T,I,A",
                            "1490119171,93.190.142.60,10.0.17.4,50413,3389,T,I,A",
                            "1490119174,46.166.190.203,10.0.17.4,56547,3389,T,I,A",
                            "1490119192,93.190.142.60,10.0.17.4,60720,3389,T,I,A",
                            "1490119193,46.166.190.203,10.0.17.4,61927,3389,T,I,A",
                            "1490119211,46.166.190.203,10.0.17.4,50441,3389,T,I,A",
                            "1490119212,93.190.142.60,10.0.17.4,54659,3389,T,I,A"
                        ]
                    }
                ]
            }
        ]
    }
}
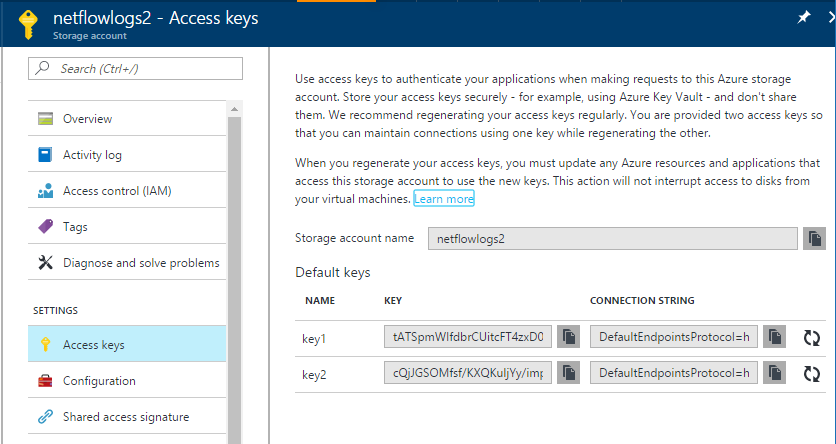
You'll want to grab a few items to keep handy for the script configuration later on. You'll need the storage account name, container name and storage account key for the storage account the logs are landing in. You can find this information on the Access Keys page within the storage account (see image below). The storage account name and key will vary, but the container name should be insights-logs-networksecuritygroupflowevent.
OMS setup
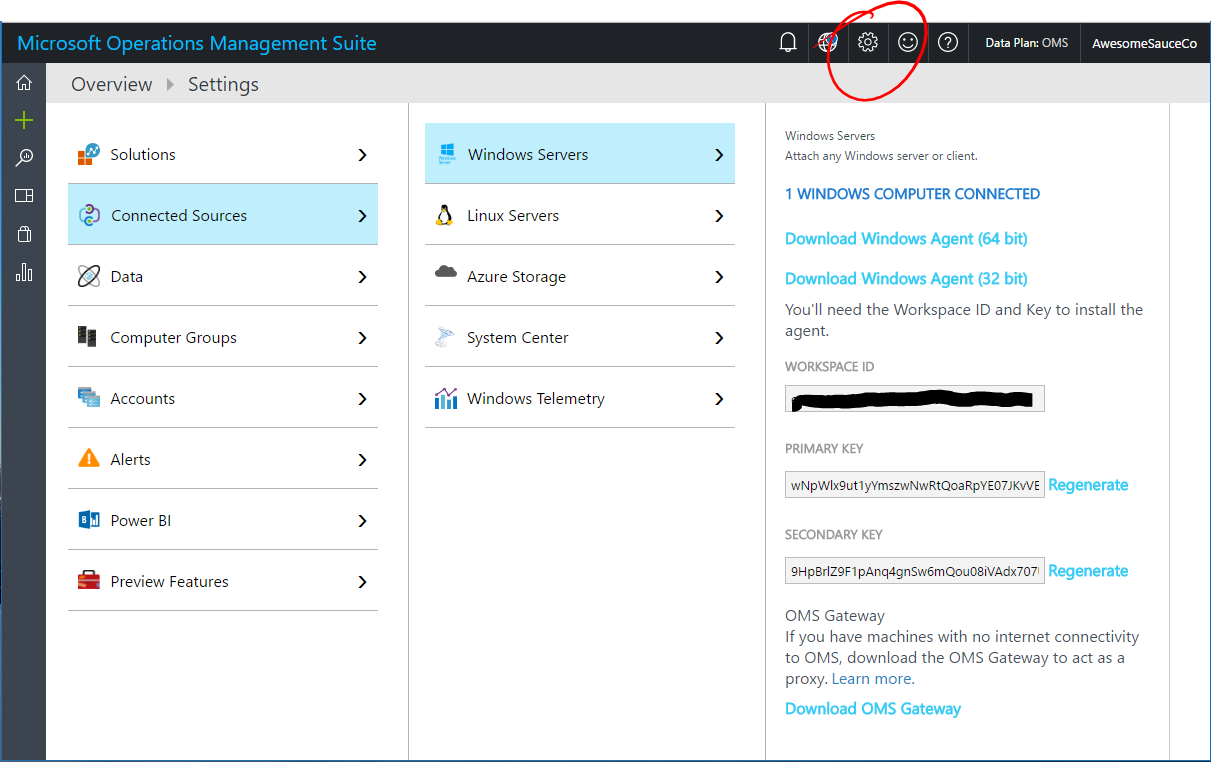
I'm not going to go through the details of getting OMS set up, here is a good primer on getting that up and running. You will, however, need a couple items in order for the script to upload data to your OMS workspace. You'll need to grab the workspace ID and primary key so that you can authenticate to the API endpoint. These can be found in your OMS portal by selecting the Settings gear in the top bar, then navigating to Connected Sources > Windows Servers (or Linux Servers) and grabbing the Workspace ID and Primary Key listed there.
The one other thing you'll need to determine is the log type that you'll want your NSG Flow Logs to show up in. The consideration here is that when performing searches, this will be the filter you'll specify to narrow your search to just the NSG logs entries. OMS automatically adds _CL to this for custom logs, so if you wanted to call them NSGFlowLogs you'd actually filter your search on Type=NSGFlowLogs_CL.
Upload script overview
So lets talk a bit about how the script itself works. The script itself can be found here. Since the NSG Flow Log isn't in a format that makes it directly uploadable to OMS, the bulk of the script functionality parses through the JSON content and pulls out the key information for each flow. The script will loop through each log file in the container and process it, with the exception of the current flow log. We want to avoid duplicate uploads to OMS and there's no easy way to determine if a specific flow record has been uploaded. Given this, the script will not process the current file that NSG Flow Logs is writing to. We also want to avoid reprocessing a file, so once the file has been processed and uploaded, the script adds a metadata entry to the blob to indicate what OMS log type the script was written to. The script will check for this value when it executes, and if that value is present (meaning it's been processed and uploaded) it will skip the file. Nothing fancy here, just some logic to protect duplicate OMS entries which could give inaccurate information. Each individual flow log entry is extracted, and posted to the Log Analytics Data Collector API. If all uploads for the file come back with a return code of 200, the metadata for the file is updated indicating that all uploads were successful.
To run the script, save it locally, change directory to the location of the script and run either of the the following commands (using either a storage account key or a SAS token), replacing the parameters with your respective values.
 # To upload using a storage account key, run this command
.\azure-nsg-flow-oms-upload.ps1 -OmsWorkspaceId xxxxxxxx-xxxx-xxxx-xxxx-xxxxxxxxxxxx -OmsSharedKey wNpW....XNjsw== -OmsLogType NsgFlowLogs -StorageAccountName MyNsgStorageAccount -StorageAccountKey tATS....YSSg==

# To upload using a SAS token, run this command
.\azure-nsg-flow-oms-upload.ps1 -OmsWorkspaceId xxxxxxxx-xxxx-xxxx-xxxx-xxxxxxxxxxxx -OmsSharedKey wNpW....XNjsw== -OmsLogType NsgFlowLogs -StorageAccountName MyNsgStorageAccount -SasToken ?sv=....aHseS4%3D
Depending on your settings for log retention, the number of flow records in the log file, and your network connection, the script can take some time to run (several hours to process a couple days of logs).
You'll need to run this script locally or on a VM somewhere (Azure VMs for instance). I attempted to get this working through Azure Automation, and while it did work, the processing was not as fast and I bumped up against the 3 hour runtime limitation on Azure Automation. If you want to continuously upload NSG Flow Logs, setting this to run as a scheduled task on a VM would work, once an hour should work since that's when the log file rolls.
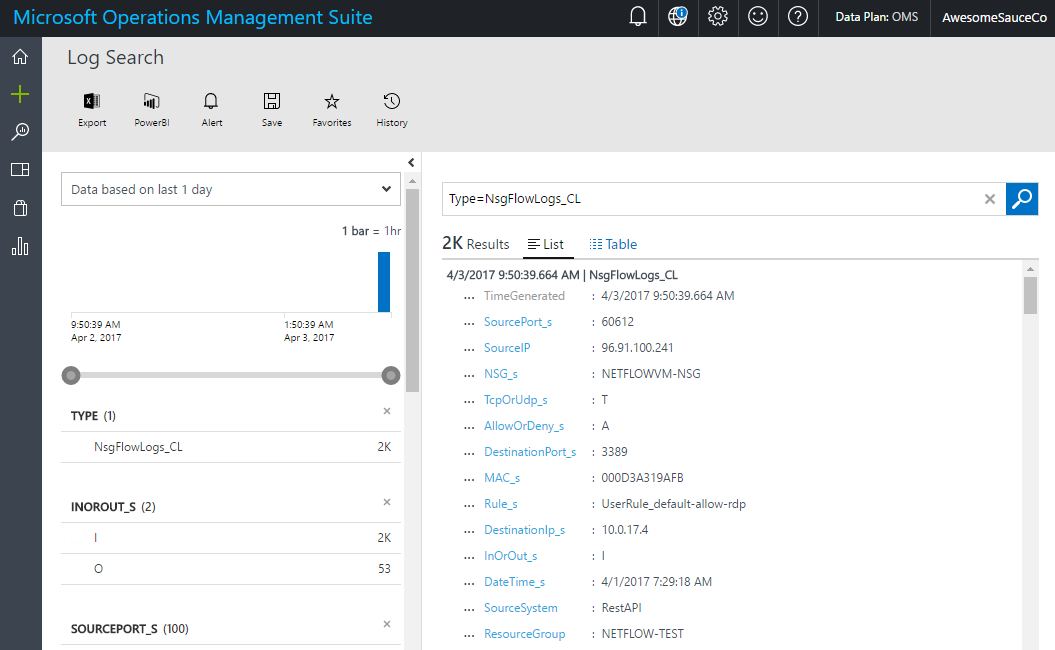
Viewing uploaded logs in OMS
Once you run the script, you should start to see logs in OMS shortly, though it can take a few minutes for records to show up and be searchable. As I mentioned earlier, you'll need to add _CL to your log type, we'll stay with the Type=NSGFlowLogs_CL as an example here. Just running a search against this will give you the full set of results, and you can then use the full Log Analytics search syntax to filter and sort the data as you'd like to see it. Each of the custom fields will have the type added to the name (_s for string, _b for boolean, etc.). You could use this to easily see what IP addresses are being blocked by a particular NSG rule, to see what ports are being allowed through an NSG, or to provide historical records on traffic going through an NSG. You can also then export the data to Excel or create reports through PowerBI. Getting the data into OMS is the key, once it's there you can leverage the full power of Log Analytics to get valuable insights out of the data.
Summary
We've looked through a bit of information on how NSG Flow Logs work and are structured, some details on this script to upload that data to OMS and what that data looks like once it's there. This shows the awesome capabilities of NSG Flow Logs coupled with OMS to help you get the most out of network logging available on Azure. Check out the links below for more information.
NSG Flow OMS Upload Script: https://github.com/jboeshart/azure-nsg-flow-oms-upload/blob/master/azure-nsg-flow-oms-upload.ps1
Log Analytics Data Collector API: /en-us/azure/log-analytics/log-analytics-data-collector-api
Azure Network Watcher: /en-us/azure/network-watcher/