Ask Learn
Preview
Ask Learn is an AI assistant that can answer questions, clarify concepts, and define terms using trusted Microsoft documentation.
Please sign in to use Ask Learn.
Sign inThis browser is no longer supported.
Upgrade to Microsoft Edge to take advantage of the latest features, security updates, and technical support.
Note
Access to this page requires authorization. You can try signing in or changing directories.
Access to this page requires authorization. You can try changing directories.
Logs are critical to any system for monitoring and diagnostics. In the world of microservices, the challenge is not only to collect logs from all the distributed services but also to enable tracing of a request and all its internal dependencies to troubleshoot which service dependency flow had the issue.
Service Fabric uses Event Tracing for Windows (ETW) to emit events on what's happening with the system. This enables microservices to not worry about routing or storing the logs, they just emit the events and whoever is listening needs to manage them. This also enables decoupling of the logging system and aligns well with 12factor.net/logs. Here is a great article on how you can listen to these events and send Service Fabric traces to ElasticSearch.
In this article I will show how we can send these traces to Application Insights and also enable tracing of every single request with all its dependencies using a unique CorrelationId. (Note: You can download the sample code for this article from here)
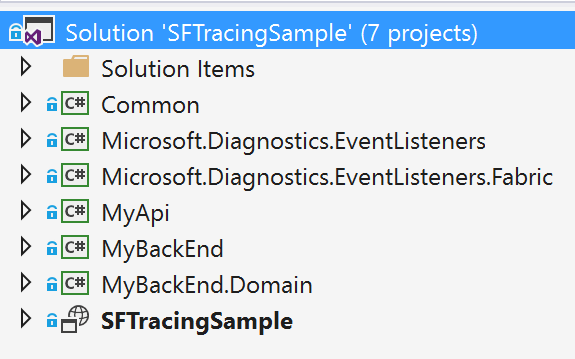
Here is what the solution structure looks like at a high level:
Now lets understand how everything came together.
For this we can reuse the "Microsoft.Diagnostics.EventListeners" and "Microsoft.Diagnostics.EventListeners.Fabric" projects from this repo which already has a bunch of listeners built-in, including one for Application Insights. In future, this may be available as nuget packages for easy integration.
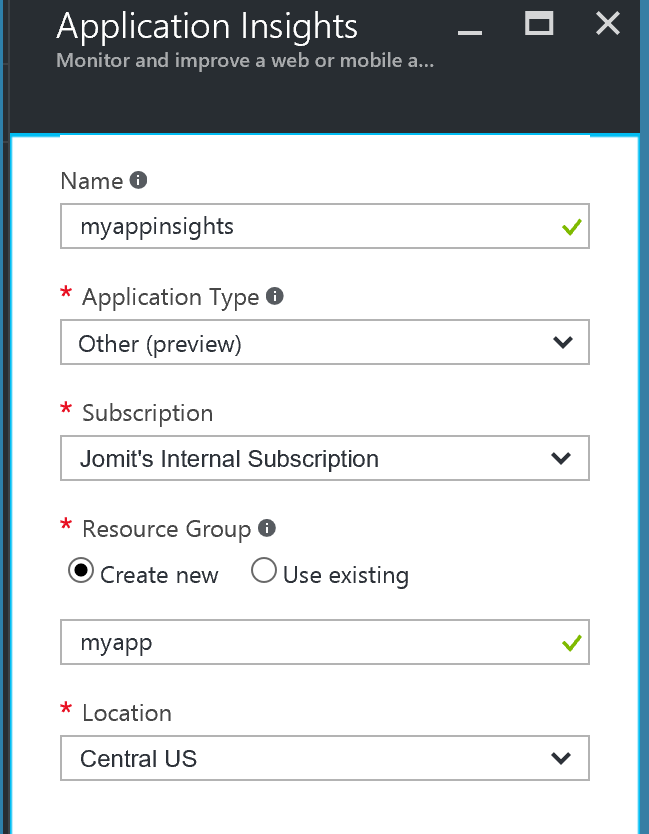
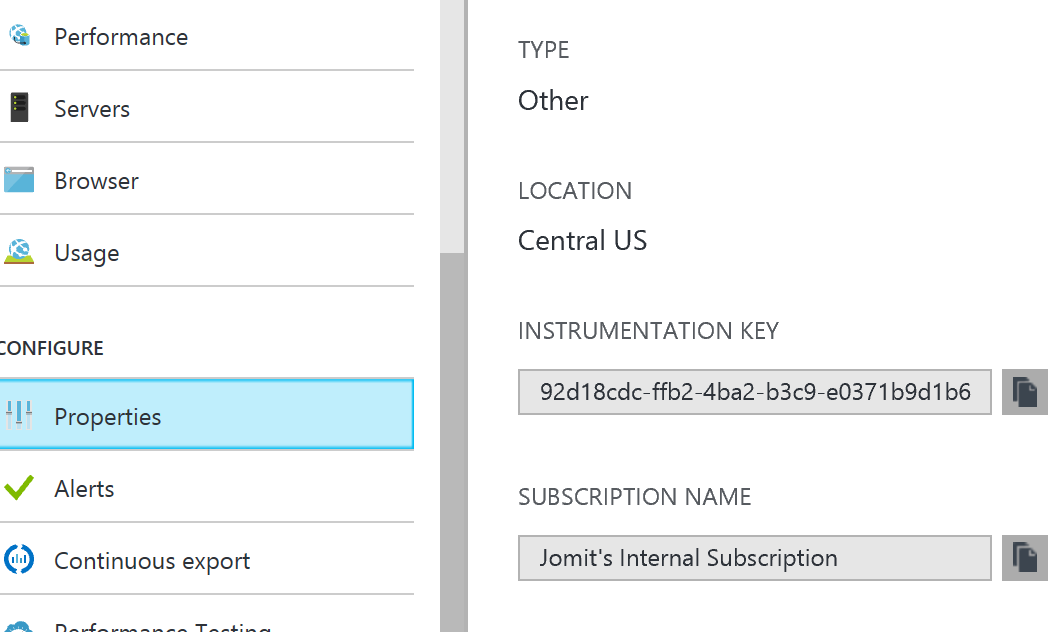
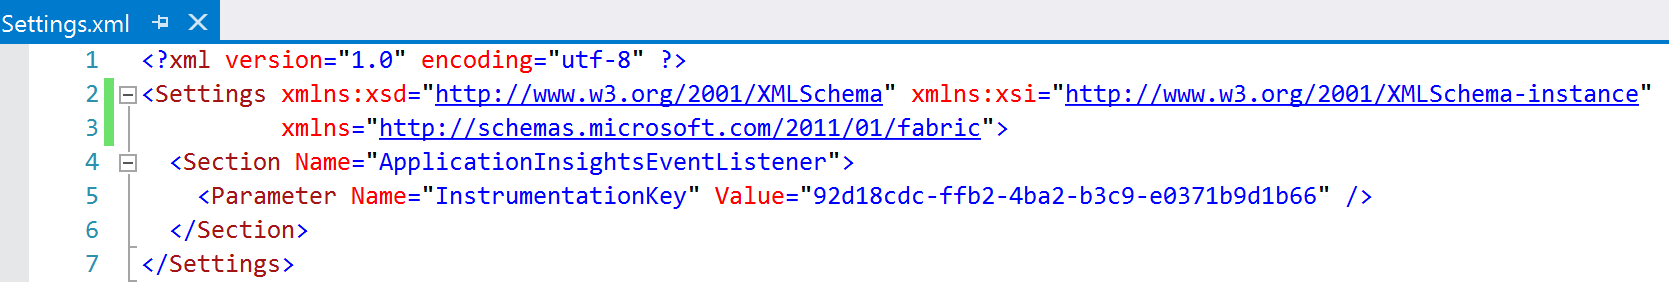
The first step of integration is to create Application Insights in Azure and get the InstrumentationKey.
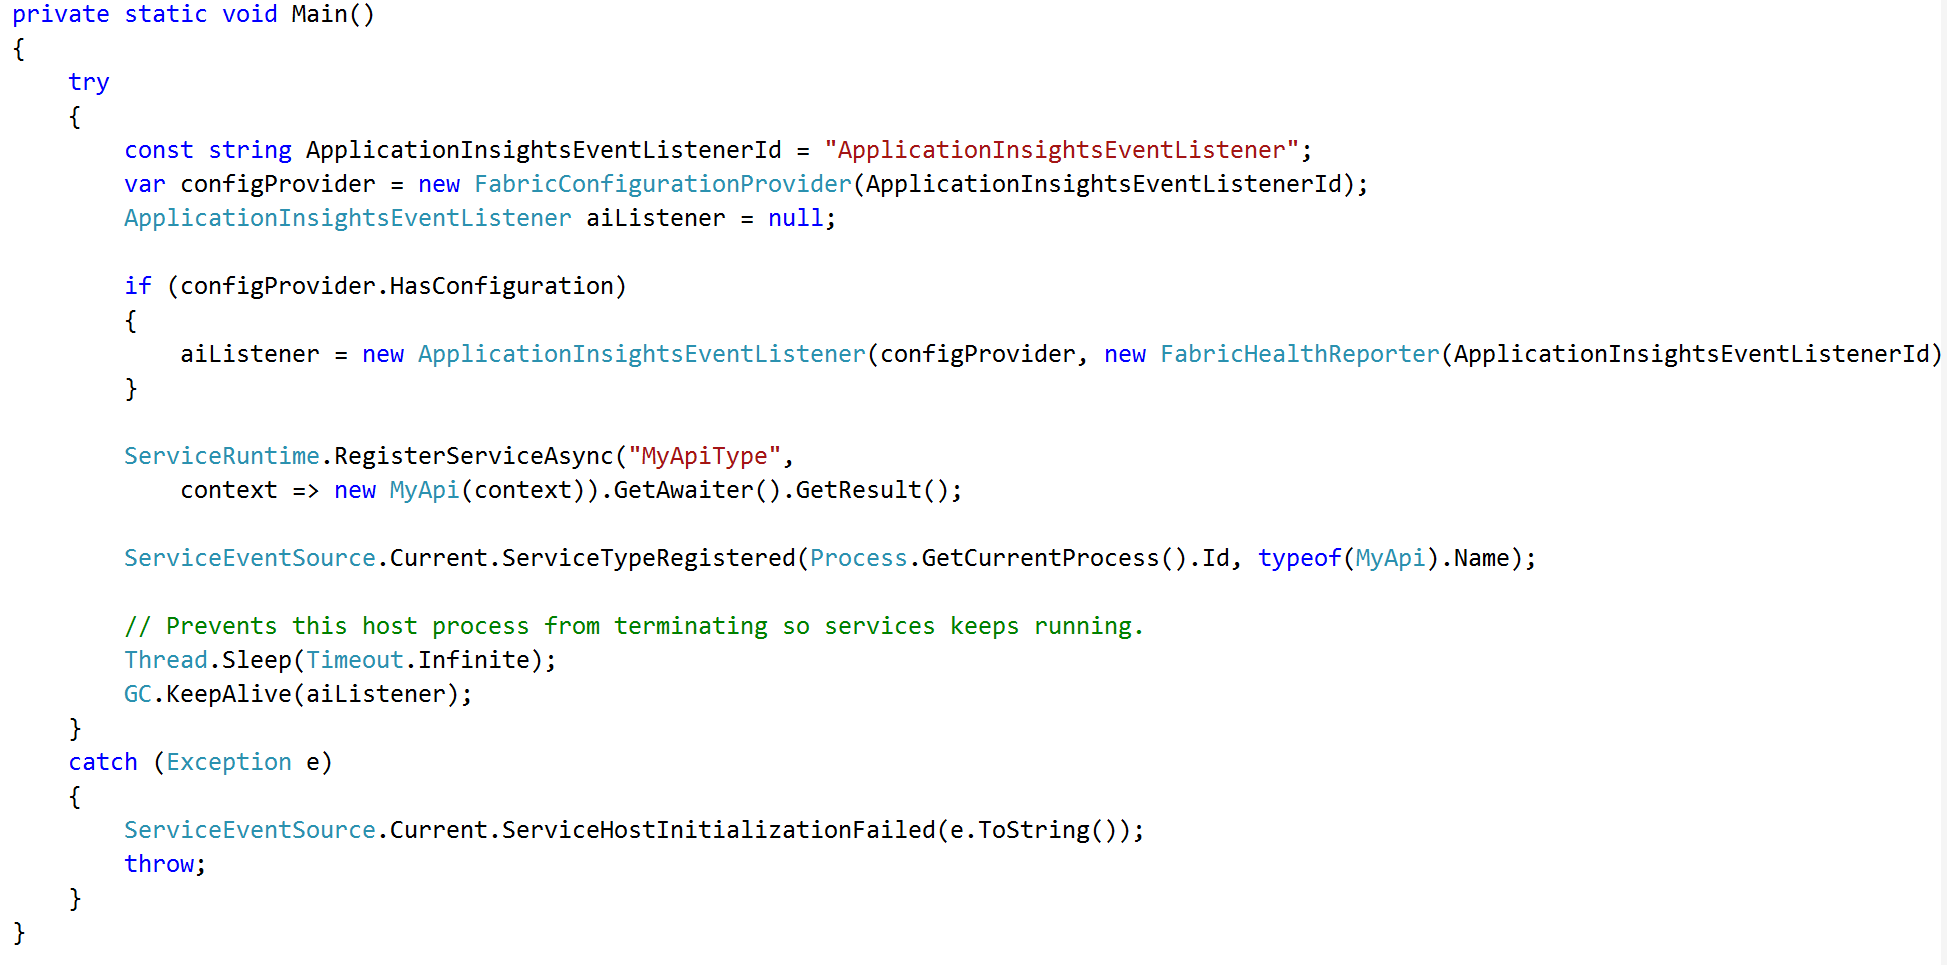
Next, integrate the listener into each of our services
Add the configuration section to provide the InstrumentationKey to the listener.
Add this for both MyApi and MyBackend Services and make sure to follow the steps shown here to add the "Microsoft.Diagnostics.Tracing" nuget package and update the using reference in the "ServiceEventSource" class for each service.
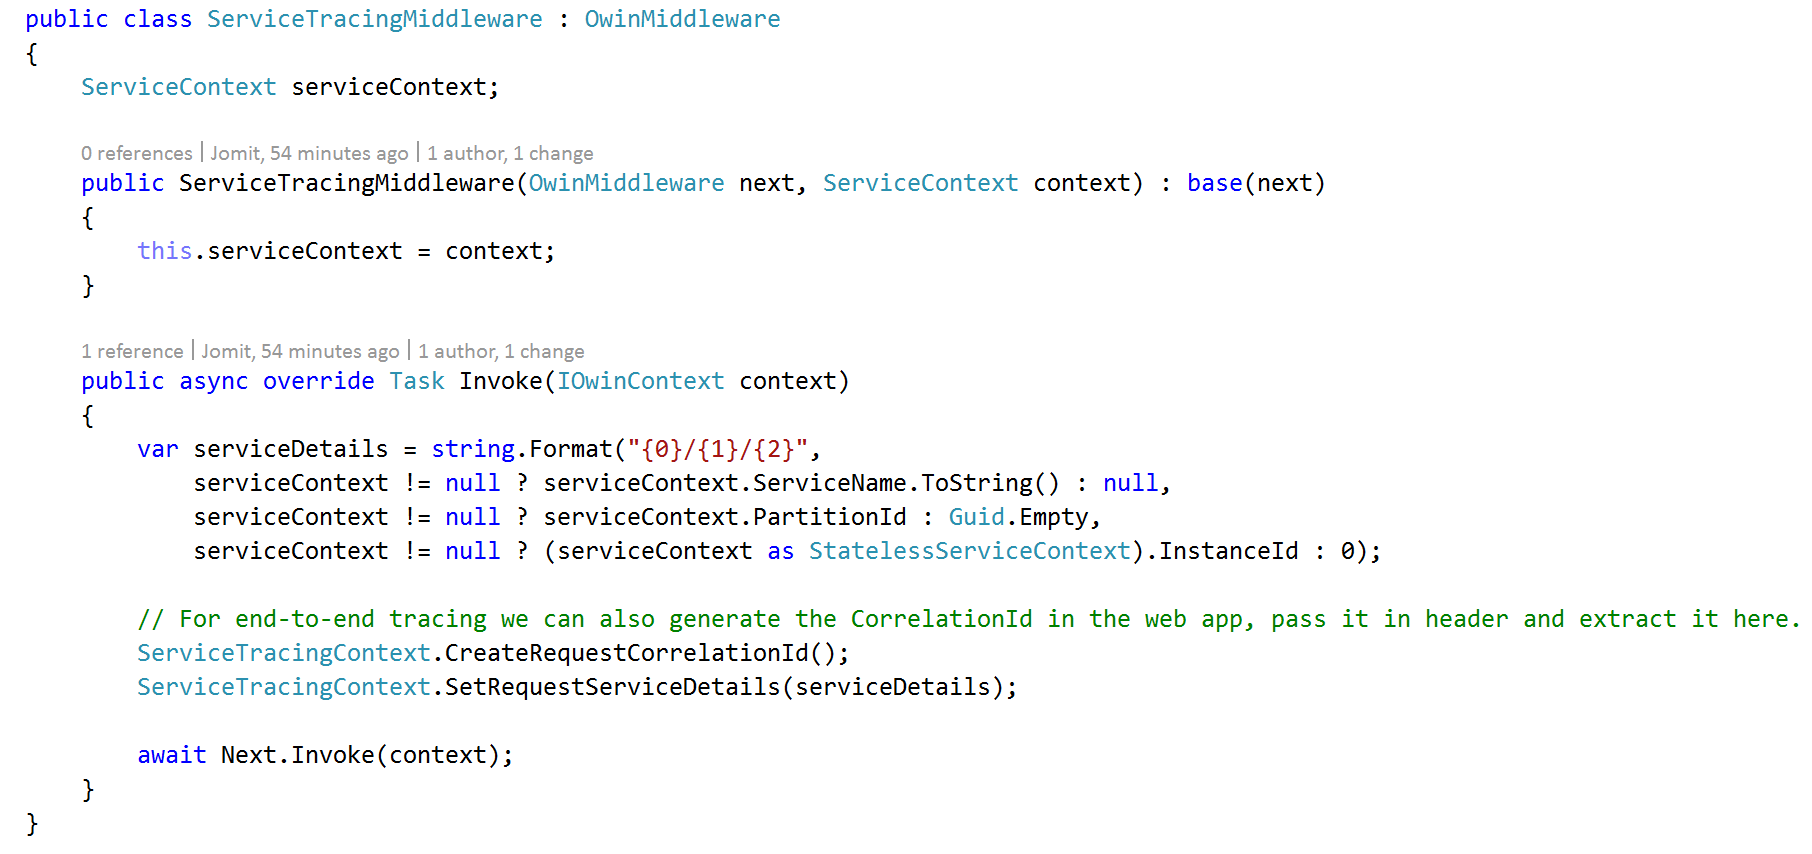
To generate a unique Id for every request create an OWIN Middleware
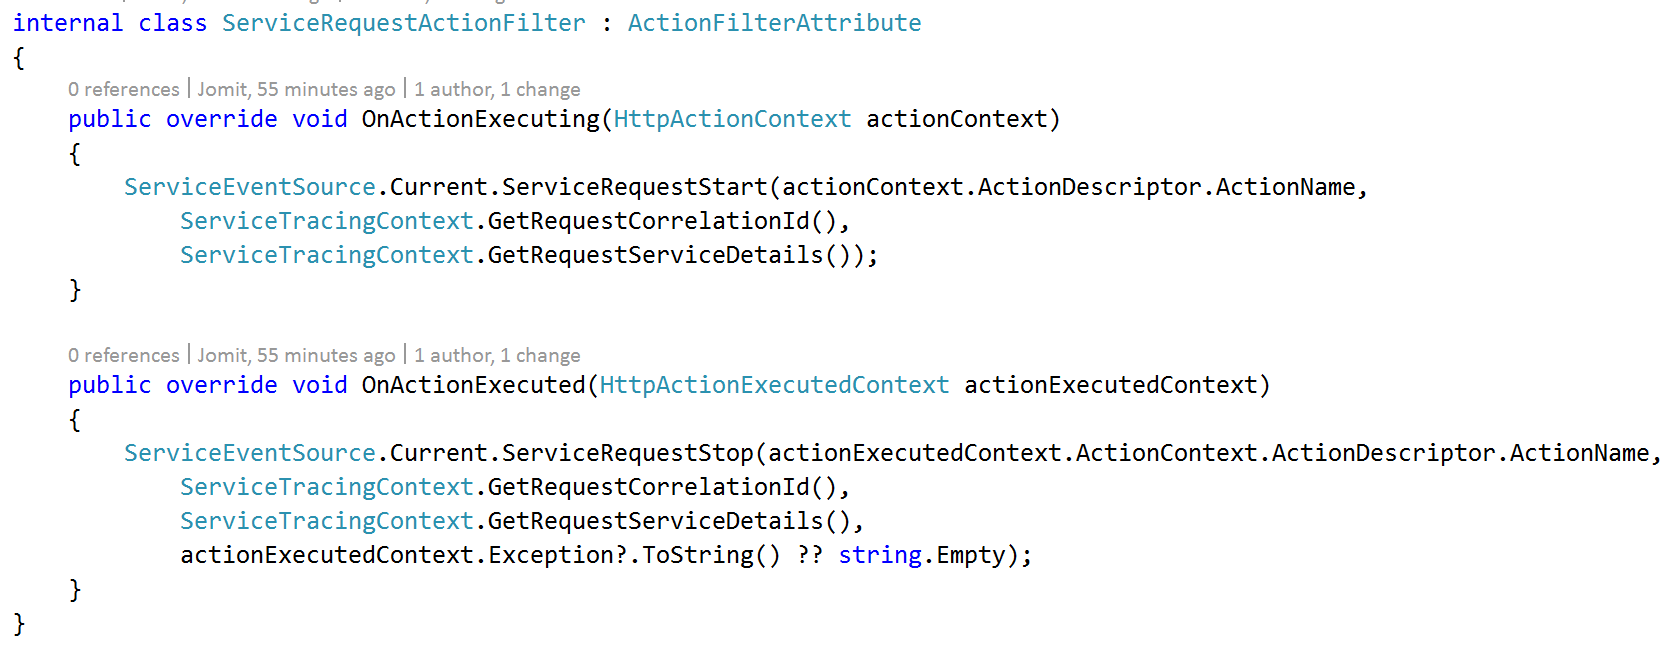
and to track the start and stop of each api call, update the code in the "ServiceRequestActionFilter" to log the extra parameters.
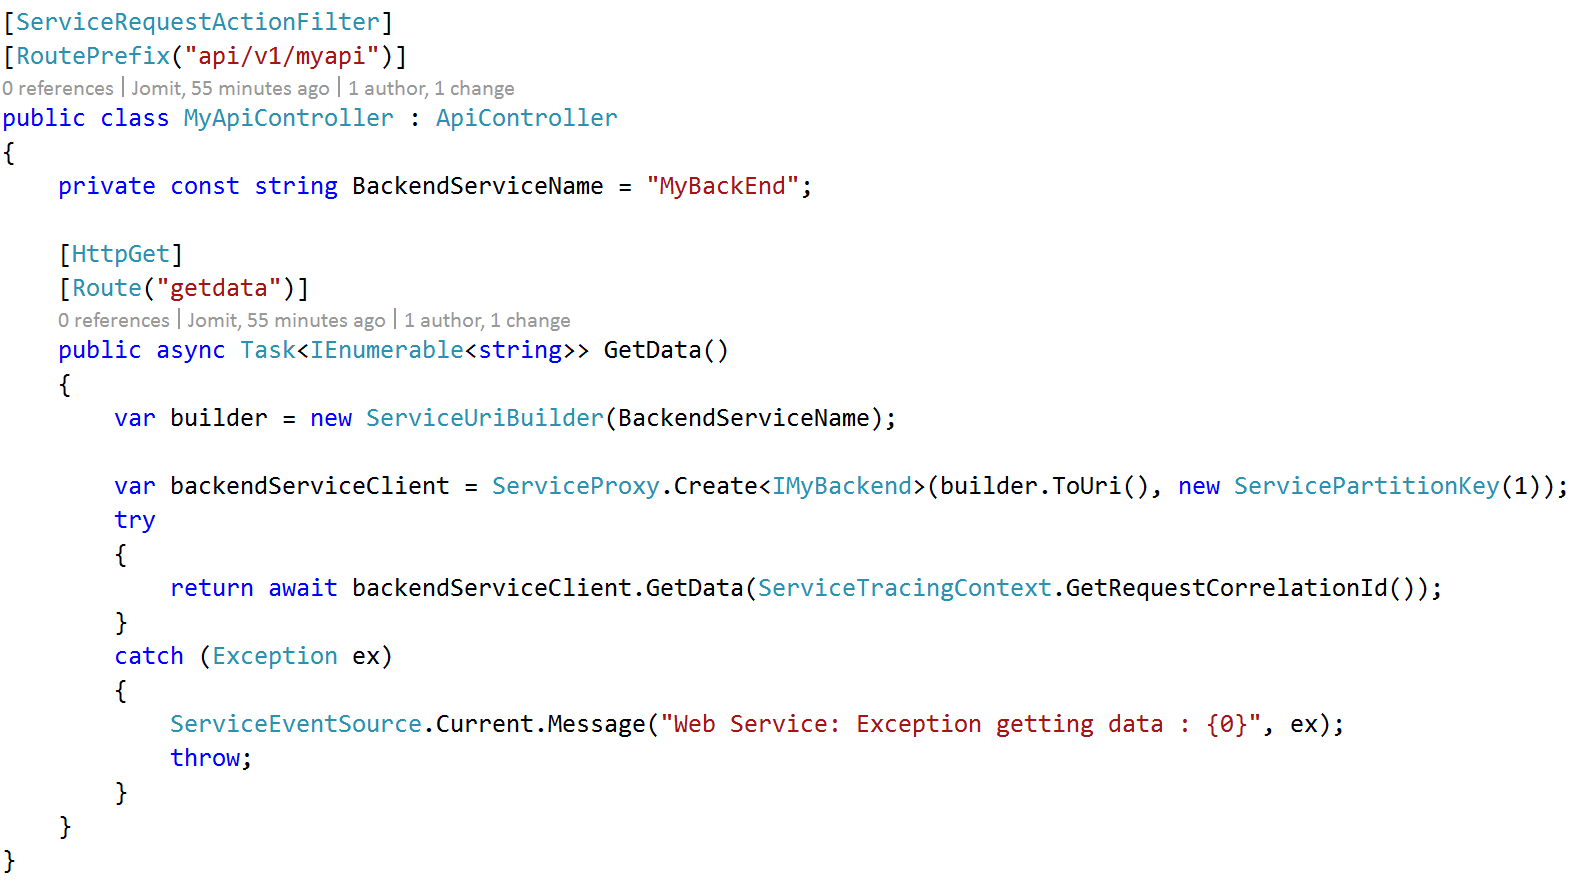
Once we integrate this, we should get the CorrelationId from the CallContext and pass it long to dependent services
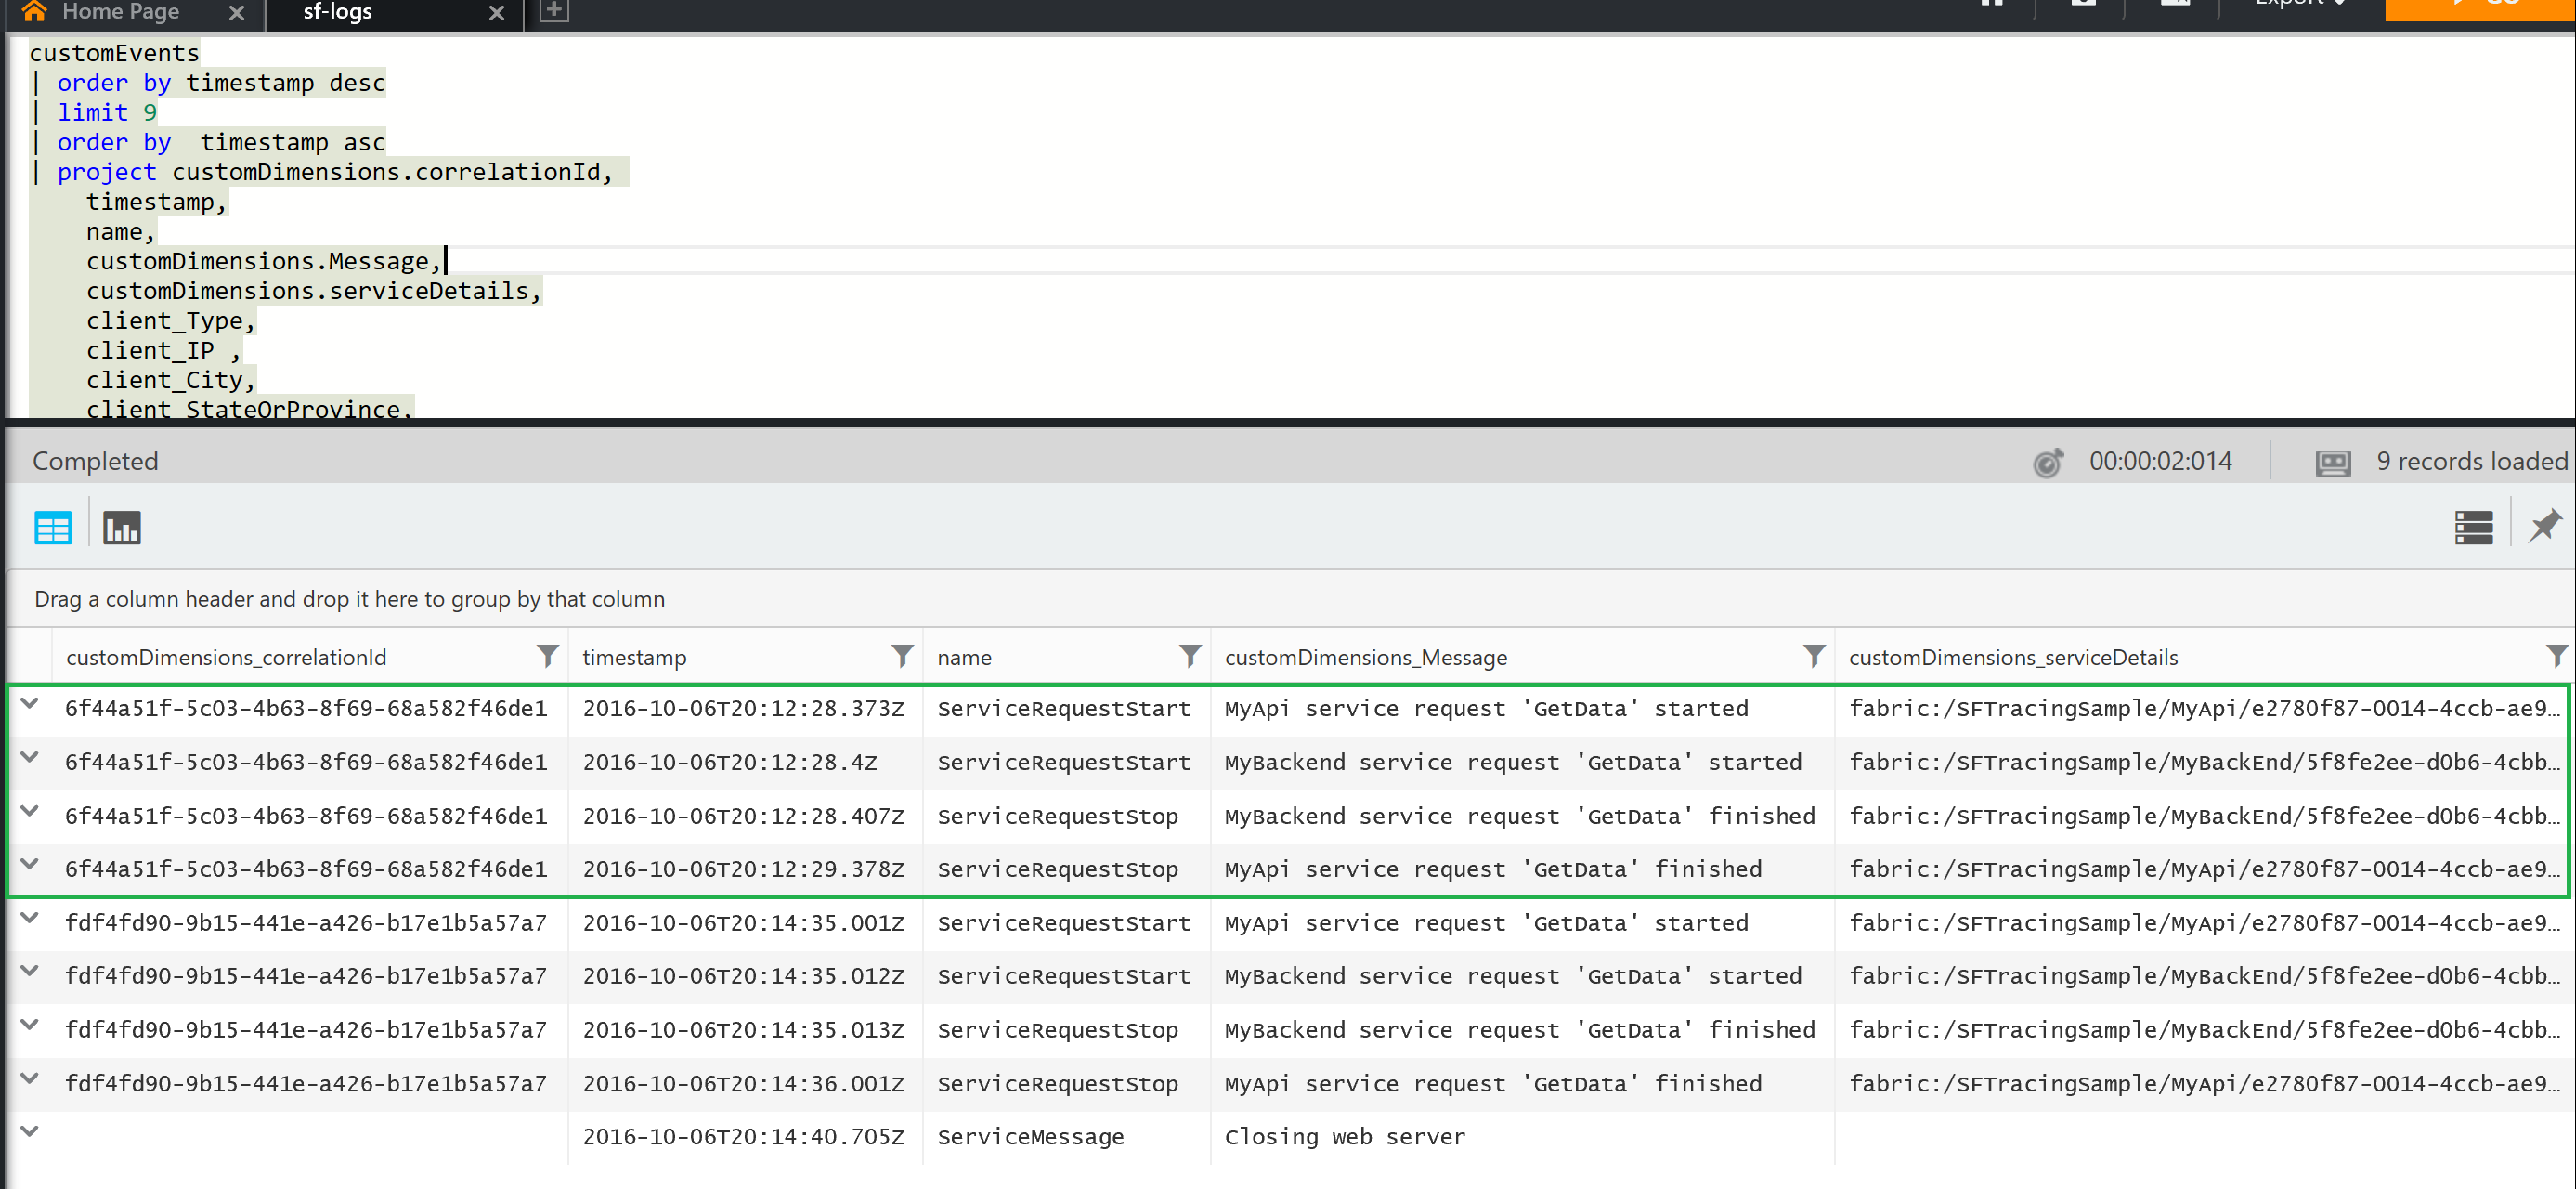
Finally, we can view our logs using the Analytics query.
Ask Learn is an AI assistant that can answer questions, clarify concepts, and define terms using trusted Microsoft documentation.
Please sign in to use Ask Learn.
Sign in