Using the Azure REST APIs to Retrieve Event Hub Metrics
Azure Event Hubs are a great way to ingest data in Azure for consumption by other services. They are a reliable "Platform as a Service" that can be scaled up to support millions of events per second, and can support multiple subscribers.
In any application, it is important to have visibility into each part of the system to detect errors or monitor performance. Azure has a rich platform that allows you to view various metric over time, create alerts, and examine operational logs.
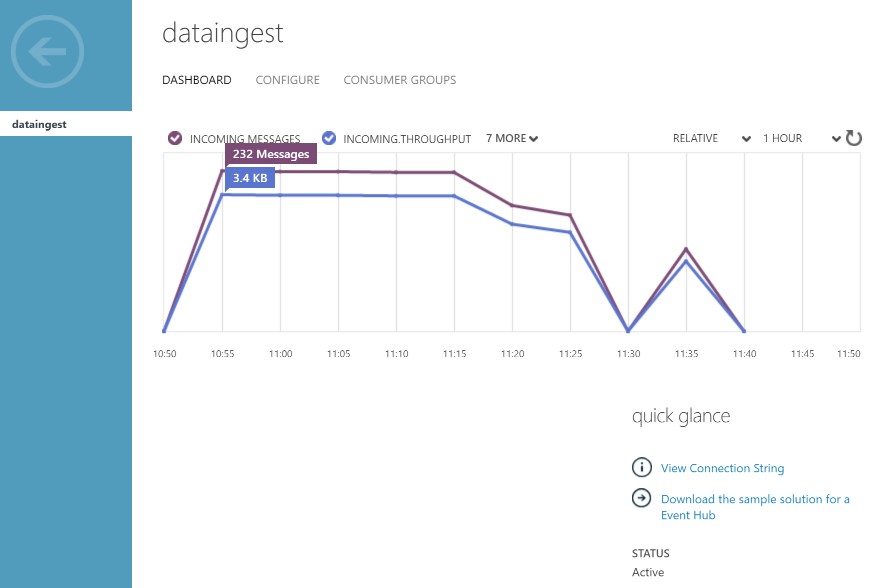
For Azure Event Hubs, the portal allows you to see the basic metrics (message rate, throughput, errors, etc.) on a graph over various time periods (minutes, hours, days, etc.). This graph can give a quick view of the service and how it is performing.
Sometimes, however, you may want to access these metrics programmatically for archival or use in other systems. For example, you may want an automated process to poll the event hub to see if any errors have occurred or if the data throughput is as expected. The Service Bus Entity Metrics REST APIs allow access to these metrics and can be used from any programming language that can make HTTP calls.
The rest of this article details how to enable API access, how the API works, and how it can be used to get metric values over different time periods.
Note: Azure is currently transitioning services from the old portal (Azure Service Manager) to the new portal (Azure Resource Manager). The API that retrieves metrics for Event Hubs is part of the older service. Thus, the techniques used here for Event Hubs may not be applicable to newer services.
Enabling API Access
Prior to using the Azure Event Hub REST APIs you need to create a “self-signed” certificate and upload it into Azure. This certificate is used to authenticate the calls to the API.
Creating the Self-Signed Certificate
Creating a self-signed certificate using PowerShell is straightforward. In a PowerShell window, issue the following command:
New-SelfSignedCertificate -CertStoreLocation Cert:\CurrentUser\My -DnsName [YOUR_DNS_NAME]
This creates a new certificate and stores it in your current user store. Be sure to replace [YOUR_DNS_NAME] with the name you wish to use, it can be anything but should be unique (e.g. scott.laptop. contoso.com)
Further information on creating certificates for other platforms can be found here.
When the command competes it outputs the "thumbprint" of your certificate. This key is used to export the certificate and is also needed when calling the API.
 Thumbprint                                Subject
----------                                -------
5DF818CA34D7C55069B147790C2835B93B380AB1  CN=scott.marketing.seattle.contoso.com
Exporting the Certificate
Next, you need to export the certificate you just created so you can upload it to Azure. To do this, issue the following PowerShell command, replacing [THUMBPRINT] with the thumbprint code from the previous command.
Export-Certificate -cert Cert:\CurrentUser\My\[THUMBPRINT] -FilePath c:\mycert.cer
This creates a certificate file called “mycert.cer” at the root of the C: drive.
Upload the Certificate to Azure
To upload the certificate into your Azure account,
- Log into the Azure classic portal
- Click Settings on the left hand side (at the bottom of the list)
- Click Management Certificates
- Click Upload (at the bottom of the page)
- Choose the certificate you exported and the subscription you wish to access and click the checkbox
You are now ready to use the Management APIs.
A guide to uploading the certificates into Azure can be found here.
Event Hub Metric API Basics
The root URL for the Event Hubs API has the following format:
https://management.core.windows.net/[SUBSCRIPTION_ID]/services/servicebus/Namespaces/[NAMESPACE]/EventHubs/[EVENT_HUB_NAME]
In the above URL, you would replace the [SUBSCRIPTION_ID] , [NAMESPACE] , and [EVENT_HUB_NAME] with the values for your subscription, service bus namespace, and event hub name.
Getting the Available Metrics
At the time of this article, the following metrics were available:
- size (bytes)
- incoming (Messages)
- total (Requests)
- successful (Requests)
- failed (Requests)
- failed.internalservererror (Requests)
- failed.serverbusy (Requests)
- failed.other (Requests)
- outgoing (Messages)
- throughput (bytes)
- throughput (bytes)
You can get a list of all the metrics available for Event Hubs, along with the information about each metric (name, unit, available aggregations, etc.) using the API by simply adding /Metrics to the end of the root URL:
https://management.core.windows.net/[SUBSCRIPTION_ID]/services/servicebus/Namespaces/[NAMESPACE]/EventHubs/[EVENT_HUB_NAME]/Metrics/
This returns a JSON object with an array of all the metrics including additional metadata about the metric. A partial example is below:
   {
    "Name": "incoming",
    "Unit": "Messages",
    "PrimaryAggregation": "Total",
    "Rollups": [
      {
        "TimeGrain": "00:05:00",
        "Retention": "02:00:00",
        "Values": null
      },
      {
        "TimeGrain": "01:00:00",
        "Retention": "7.00:00:00",
        "Values": null
      },
      {
        "TimeGrain": "1.00:00:00",
        "Retention": "60.00:00:00",
        "Values": null
      },
      {
        "TimeGrain": "7.00:00:00",
        "Retention": "730.00:00:00",
        "Values": null
      }
    ],
    "DisplayName": "Incoming Messages"
  },
  {
    "Name": "requests.total",
    "Unit": "Requests",
    "PrimaryAggregation": "Total",
    "Rollups": [
      {
        "TimeGrain": "00:05:00",
        "Retention": "02:00:00",
        "Values": null
      },
      {
        "TimeGrain": "01:00:00",
        "Retention": "7.00:00:00",
        "Values": null
      },
      {
        "TimeGrain": "1.00:00:00",
        "Retention": "60.00:00:00",
        "Values": null
      },
      {
        "TimeGrain": "7.00:00:00",
        "Retention": "730.00:00:00",
        "Values": null
      }
    ],
    "DisplayName": "Total Requests"
  },
  {
    "Name": "requests.successful",
    "Unit": "Requests",
    "PrimaryAggregation": "Total",
    "Rollups": [
      {
        "TimeGrain": "00:05:00",
        "Retention": "02:00:00",
        "Values": null
      },
      {
        "TimeGrain": "01:00:00",
        "Retention": "7.00:00:00",
        "Values": null
      },
      {
        "TimeGrain": "1.00:00:00",
        "Retention": "60.00:00:00",
        "Values": null
      },
      {
        "TimeGrain": "7.00:00:00",
        "Retention": "730.00:00:00",
        "Values": null
      }
    ],
    "DisplayName": "Successful Requests"
  },
  ...
In the above JSON, you can see that the metric with display name Incoming Messages has the unit of Messages and the primary aggregation is Total (vs. Average or Max). You can also see that this metric is rolled up into the following aggregations:
- Every 5 minutes over the past 2 hours
- Every 1 hour over the past 7 days
- Every 1 day over the past 60 days
- Every week over the past 2 years
This means that this metric's data is summed up every 5 minutes but only over the past 2 hours. After that, the data is summed up for each hour over the past 7 days, then every day over the past 60 days, and so on.
Choosing a Rollup Period
When requesting metric data from the API, you need to indicate which rollup you want. Each rollup has a code and this code is used to specify the rollup type. The rollup type codes are as follows:
- PT5M - 5-minute rollup
- PT1H - 1-hour rollup
- P1D - 1-day rollup
- P7D - 1-week (7 days) rollup
In addition to the rollup type, you need to specify a time filter. This filter is used to specify the time range for the data request. It consists of one or more filter expression described below:
| Filter Expression | Timestamp <Logical Operator> <Value> AND <Filter expression> | |
| Logical Operator | Eq | Ne | Gt | Ge | Lt | Le |
Examples:
All data on or after 21:00 5/23/16 UTC
Timestamp%20ge%20datetime'2016-05-23T21:00:00Z'
All data between 21:00 5/23/16 and 21:00 5/24/16
Timestamp%20ge%20datetime'2016-05-23T21:00:00Z'%20AND%20Timestamp%20le%20datetime'2016-05-24T21:00:00Z'
Putting it all Together to Retrieve Metric Values
Combining the metric name, rollup period, and date filter, the API URL has the following format:
[BASE_URL]/Metrics/[METRIC_NAME]/Rollups/[ROLLUP_TYPE]/Values?$filter=[FILTER_VALUE]
Thus, a request for the requests.total metric for an Event Hub named myeventhub in the myservicebus namespace in subscription ID 23ae2468-39f9-4257-8673-d1cd7f51792f using the 5-minute rollup for data from 5/23/16 21:00 Z would look like:
https://management.core.windows.net/23ae2468-39f9-4257-8673-d1cd7f51792f/services/servicebus/Namespaces/myservicebus/EventHubs/myeventhub/Metrics/requests.total/Rollups/PT5M/Values?$filter=Timestamp%20ge%20datetime'2016-05-23T21:00:00Z'
API Response Data
In response to this call, you get a JSON object that contains all the data requested. An example is below:
[
  {
    "Timestamp": "2016-05-24T18:00:00Z",
    "Min": 231,
    "Max": 231,
    "Total": 231,
    "Average": 0.0
  },
  {
    "Timestamp": "2016-05-24T18:05:00Z",
    "Min": 231,
    "Max": 231,
    "Total": 231,
    "Average": 0.0
  },
  {
    "Timestamp": "2016-05-24T18:10:00Z",
    "Min": 230,
    "Max": 230,
    "Total": 230,
    "Average": 0.0
  }
]
In the above example, I requested the incoming metric and got three values in 5-minute interval. Event Hub data is reported with a 15-minute delay so don’t expect to see data right away after sending events to a hub.
If there is no data for this metric over the period, you will get an empty JSON object:
[]
Using the Metric Data – Sample Project
There are many ways to make use of this data. You could call the API via PowerShell or Curl and then send the results to a text file, or another process.
In a project I was working on, I wanted a way to print metric data to the screen and save it in a CSV file for later analysis in Excel. To do this, I created a C# console application that calls the APIs using System.Net.HttpWebRequest.
This project can be found on Github here: https://github.com/Microsoft/EventHubData
The EventHubData application can either a) list the available metrics (and their metadata) for an Event Hub, or b) pull the metrics specified in a config file and display them on screen while also persisting them to a file.
EventHubData showavail|getmetrics
showavail -  show all metrics available for the event hub in the config
getmetrics - get metric values for metrics indicated in the config and also save to a CSV
To get the available metrics, run the console application with the showavail argument:
C:\source\EventHubData\EventHubData\bin\Debug>EventHubData.exe showavail
Getting available metrics...
Display Name: Size Name: size Unit: bytes Aggregation: Max
Rollups for this metric:
Time Grain: 00:05:00 Retention: 02:00:00
Time Grain: 01:00:00 Retention: 7.00:00:00
Time Grain: 1.00:00:00 Retention: 60.00:00:00
Time Grain: 7.00:00:00 Retention: 730.00:00:00
Display Name: Incoming Messages Name: incoming Unit: Messages Aggregation: Total
Rollups for this metric:
Time Grain: 00:05:00 Retention: 02:00:00
Time Grain: 01:00:00 Retention: 7.00:00:00
...
This shows you what metrics are available along with their unit, aggregation, and rollups. To pull metric data, edit the app.config file and set the following values:
- "SubscriptionId" - the ID of the subscription to use
- "CertificateThumbprint" - the thumbprint of the certificate to use
- "ServiceBusNamespace" - the namespace of the Service Bus the Event Hub resides in
- "EventHubName" - the name of the Event Hub
- "MetricsToWatch" - pipe delimited list of the metric names to watch
- "RollupPeriod" - the rollup period to use. One of the following: PT5M, PT1H, P1D, P7D
- "HowFarToLookBackInMinutes" - how far back in time to look when requesting metric data
Running the application with the getmetrics argument retrieves the most recent value for each of the metrics indicated in the app.config file. An example of the application running is below:
C:\source\EventHubData\EventHubData\bin\Debug>EventHubData.exe getmetrics
Getting available metrics...
Writing data to file: EventHubMetrics_2016_05_23_22_26_36.csv
Getting metrics since 2016-05-23T21:56:36.650Z...
incoming Value: 184 Messages At: 5/23/2016 10:15:00 PM
requests.total Value: 185 Requests At: 5/23/2016 10:15:00 PM
requests.successful Value: 185 Requests At: 5/23/2016 10:15:00 PM
requests.failed Value: 0 Requests At: 1/1/0001 12:00:00 AM
incoming.throughput Value: 2760 bytes At: 5/23/2016 10:15:00 PM
Waiting 5 minutes.
This program runs until stopped (control+c). While it runs it also saves the data into the indicated .CSV file with the first row as the header row:
incoming,requests.total,requests.successful,requests.failed,incoming.throughput,timestamp
184,185,185,0,2760,5/23/2016 10:15:00 PM
Summary
Although the Azure Portal has built in reporting, sometimes you want access to metric data programmatically. After they are enabled by uploading a management certificate, the Azure Event Hub Management APIs make it easy to pull Event Hub metrics and make them available for reporting and monitoring. The referenced sample shows how the API can be used in .NET to display data to the screen and save it to a file.