Using Application Insights to instrument your worker roles
Today there isn't a simple way to integrate the power of Application Insights into your worker role code. The focus of the team so far has really been on instrumenting web applications. I hope there will be improved tooling in this area in the future. In the interim however you can use the TelemetryClient object from the Microsoft.ApplicationInsights namespace to push exceptions and trace information into Application Insights for searching and viewing later.
Here is a step-by-step guide for getting started:
1) Add the Application Insights nuget package to your project. From the package manager console:
Install-Package Microsoft.ApplicationInsights -Pre
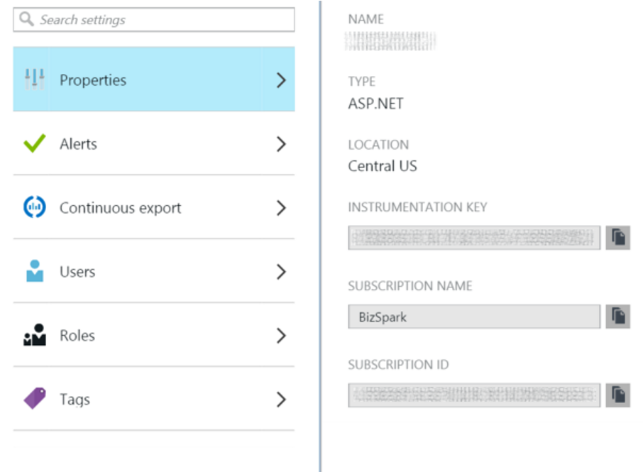
2) Create a new Application Insights instance from the Azure portal and grab your
instrumentation key:
3) In the app.config of your application add an app setting for tracking your instrumentation key.
  <add key="AppInsightsInstrumentationKey"
 value="XXXXXXXXXXXXX"/>
4) Create a static class which implements TrackException and TrackTrace methods that you can call from your code. Here is my full implementation.
 using System;
 using System.Collections.Generic;
 using System.Diagnostics;
 using System.Configuration;
 using Microsoft.ApplicationInsights;
 using Microsoft.ApplicationInsights.DataContracts;

 namespace Error
 {
 public static class Diagnostics
 {
 public enum Severity { Error, Information, Critical, Verbose, Warning };
 private static TelemetryClient telemetryClient = new TelemetryClient();
 static Diagnostics()
 {
 //Setup our telemtry client to be able to call
 string appInsightsKey = ConfigurationManager.AppSettings["AppInsightsInstrumentationKey"];
 telemetryClient.InstrumentationKey = appInsightsKey;
 }

 public static void TrackException(Exception thrownException, int eventID, string message)
 {
 //Data to push into AI which can be searched on
 Dictionary<string, string> prop = new Dictionary<string, string>();
 prop["message"] = message;
 prop["eventID"] = eventID.ToString();
 telemetryClient.TrackException(thrownException, prop);

 //Log to System.Diagnostics as well for redundancy
 Trace.TraceError("Exception: {0}, Message:{1}", thrownException.GetType().FullName, thrownException.Message);
 }


 public static void TrackTrace(string message, Severity sev)
 {
 try
 {
 TraceTelemetry telemetry = new Microsoft.ApplicationInsights.DataContracts.TraceTelemetry();
 Dictionary<string, string> prop = new Dictionary<string, string>();


 telemetry.Message = message;
 telemetry.Timestamp = DateTime.UtcNow;

 switch (sev)
 {
 case Severity.Critical:
 telemetry.SeverityLevel = Microsoft.ApplicationInsights.DataContracts.SeverityLevel.Critical;
 break;

 case Severity.Error:
 telemetry.SeverityLevel = Microsoft.ApplicationInsights.DataContracts.SeverityLevel.Error;
 break;

 case Severity.Information:
 telemetry.SeverityLevel = Microsoft.ApplicationInsights.DataContracts.SeverityLevel.Information;
 break;

 case Severity.Verbose:
 telemetry.SeverityLevel = Microsoft.ApplicationInsights.DataContracts.SeverityLevel.Verbose;
 break;

 case Severity.Warning:
 telemetry.SeverityLevel = Microsoft.ApplicationInsights.DataContracts.SeverityLevel.Warning;
 break;
 }

 telemetryClient.TrackTrace(telemetry);

 //Log to System.Diagnostics as well for redundancy
 Trace.WriteLine(String.Format("Message:{0}, Severity:{1}", message, sev));

 }
 catch (Exception ex)
 {
 TrackException(ex, 0, "Error writing trace");
 }

 }
 }
 }
6) Now whenever I want to log a trace or exception I can just call the associated methods on my class and know the data is getting sent to both Application Insights and any trace listeners configured in System.Diagnostics.
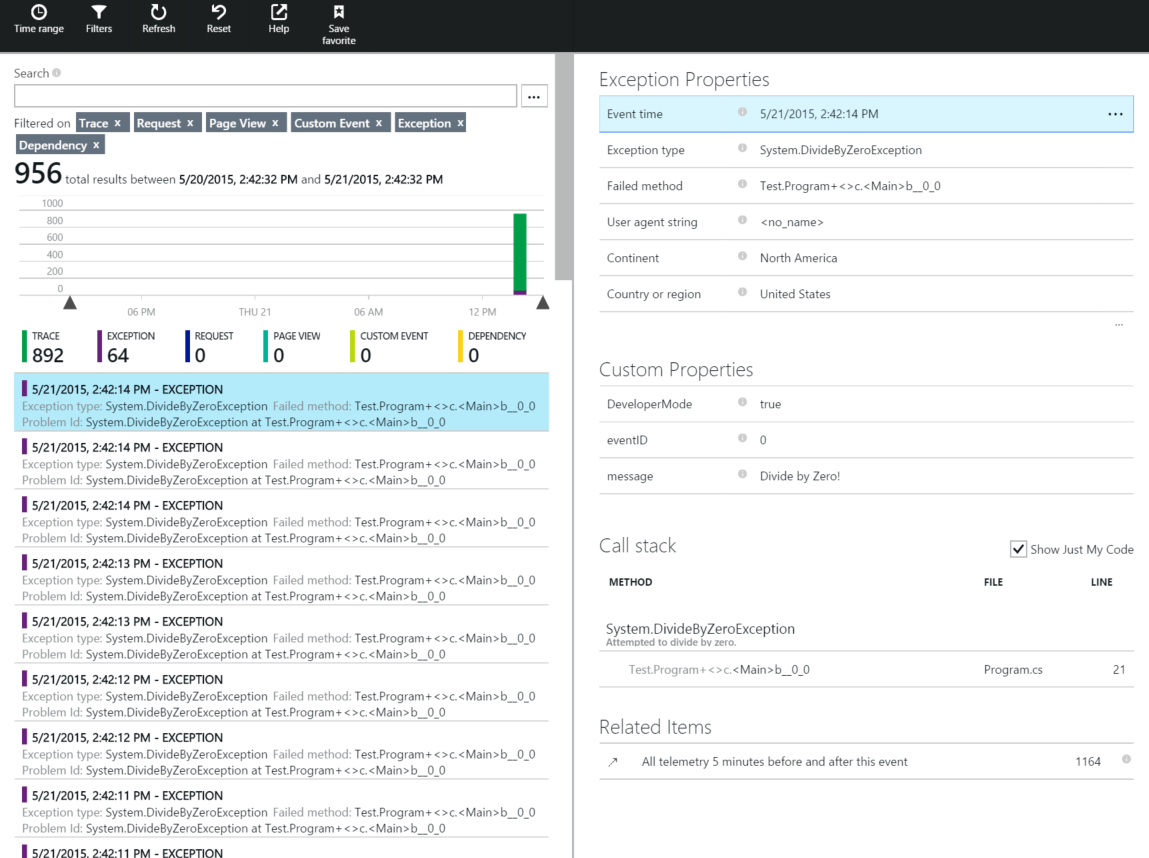
7) When you log back into the Azure portal and look at your Application Insight instance under the "search" section you can see all of your events. This allows you to filter and view on any properties (including the custom EventID that we passed). You can see the full stack trace as well.
It is worth noting that there is also a nuget package called "Microsoft.ApplicationInsights.TraceListener". With this you can leverage the existing System.Diagnostic telemetry and register Application Insights as an output trace listener. This will pump your trace data into Application Insights. The problem is that you don't have as granular control for additional properties and exception stack tracing.