Azure Diagnostics for Azure Virtual Machines
Azure Diagnostics has been provided for Azure Cloud Services since they went GA in 2010. This feature uses an agent deployed to each role instance to capture and persist diagnostic and telemetry data. Azure Diagnostics uses a configuration file to specify the information to be captured and the frequency with which the information is persisted to Azure Storage. The persisted information can be consumed directly out of Azure Storage for subsequent analysis. The Azure Portal can also be configured to display any performance counter data persisted to Azure Storage.
Azure Diagnostics is now supported for VMs running Window Server in Azure Virtual Machines. The feature is implemented as the IaaSDiagnostics VM extension. When the IaaSDiagnostics extension is added to a VM, the Azure Diagnostics agent is deployed to the VM and then configured with a provided configuration file. The IaaSDiagnostics extension can be added to a VM using:
Azure Diagnostics supports the capture and persistence from a wide variety of data sources on a VM:
- Crash Dumps
- Diagnostics Infrastructure Logs (from the Diagnostics Agent itself)
- Directories (arbitrary log files in watched directories on the VM)
- Etw Providers (structured logging using Event Tracing for Windows)
- Failed Request Logs
- IIS Logs
- Metrics
- Performance Counters
- Windows Event Log
This diagnostic information is persisted to a specified account in Azure Storage. For performance reasons this storage account should not also be used for production data. Furthermore, for security isolation it should ideally be in a different subscription from that used for production data.
On the preview Azure Portal, the monitoring section of the Virtual Machine blade can be used to configure the diagnostics information to be captured and persisted. It also allows for the selection of monitoring data to be displayed on the portal. The PowerShell cmdlets can be used to configure Azure Diagnostics when a broader set of data must be captured and persisted. There is a tutorial on the Azure website showing how to use Azure Diagnostics for both Cloud Services and Azure Virtual Machines.
Preview Azure Portal
The preview Azure Portal can be used to configure Azure Diagnostics. Khalid Mouss explains how to do this in the post announcing the Azure Diagnostics Extension. In this Azure Friday webcast, Scott Hanselman and Vishal Joshi show how to use the preview Azure Portal to configure the Diagnostic lens.
Clicking on one of the lenses in the Monitoring tab for a VM brings up the Metric blade. Clicking on the Diagnostics button then brings up the Diagnostics blade which can be used to configure diagnostics. A selection of pre-configured diagnostics metrics and logs can be added to the Azure Diagnostics configuration deployed to the VM. The preview Azure Portal does not support the direct modification of the actual metrics selected in these sets. However, the PowerShell cmdlets can be used to retrieve the initial configuration file, modify it, and then upload it. The predefined metric set is:
- Basic metrics
- Network and web metrics
- .NET metrics
- Windows Event System logs
- Windows event security logs
- Windows event application logs
- Diagnostics infrastructure logs
- IIS logs
The following screenshot shows the VM, Metric and Diagnostics blades open on the preview Azure Portal:
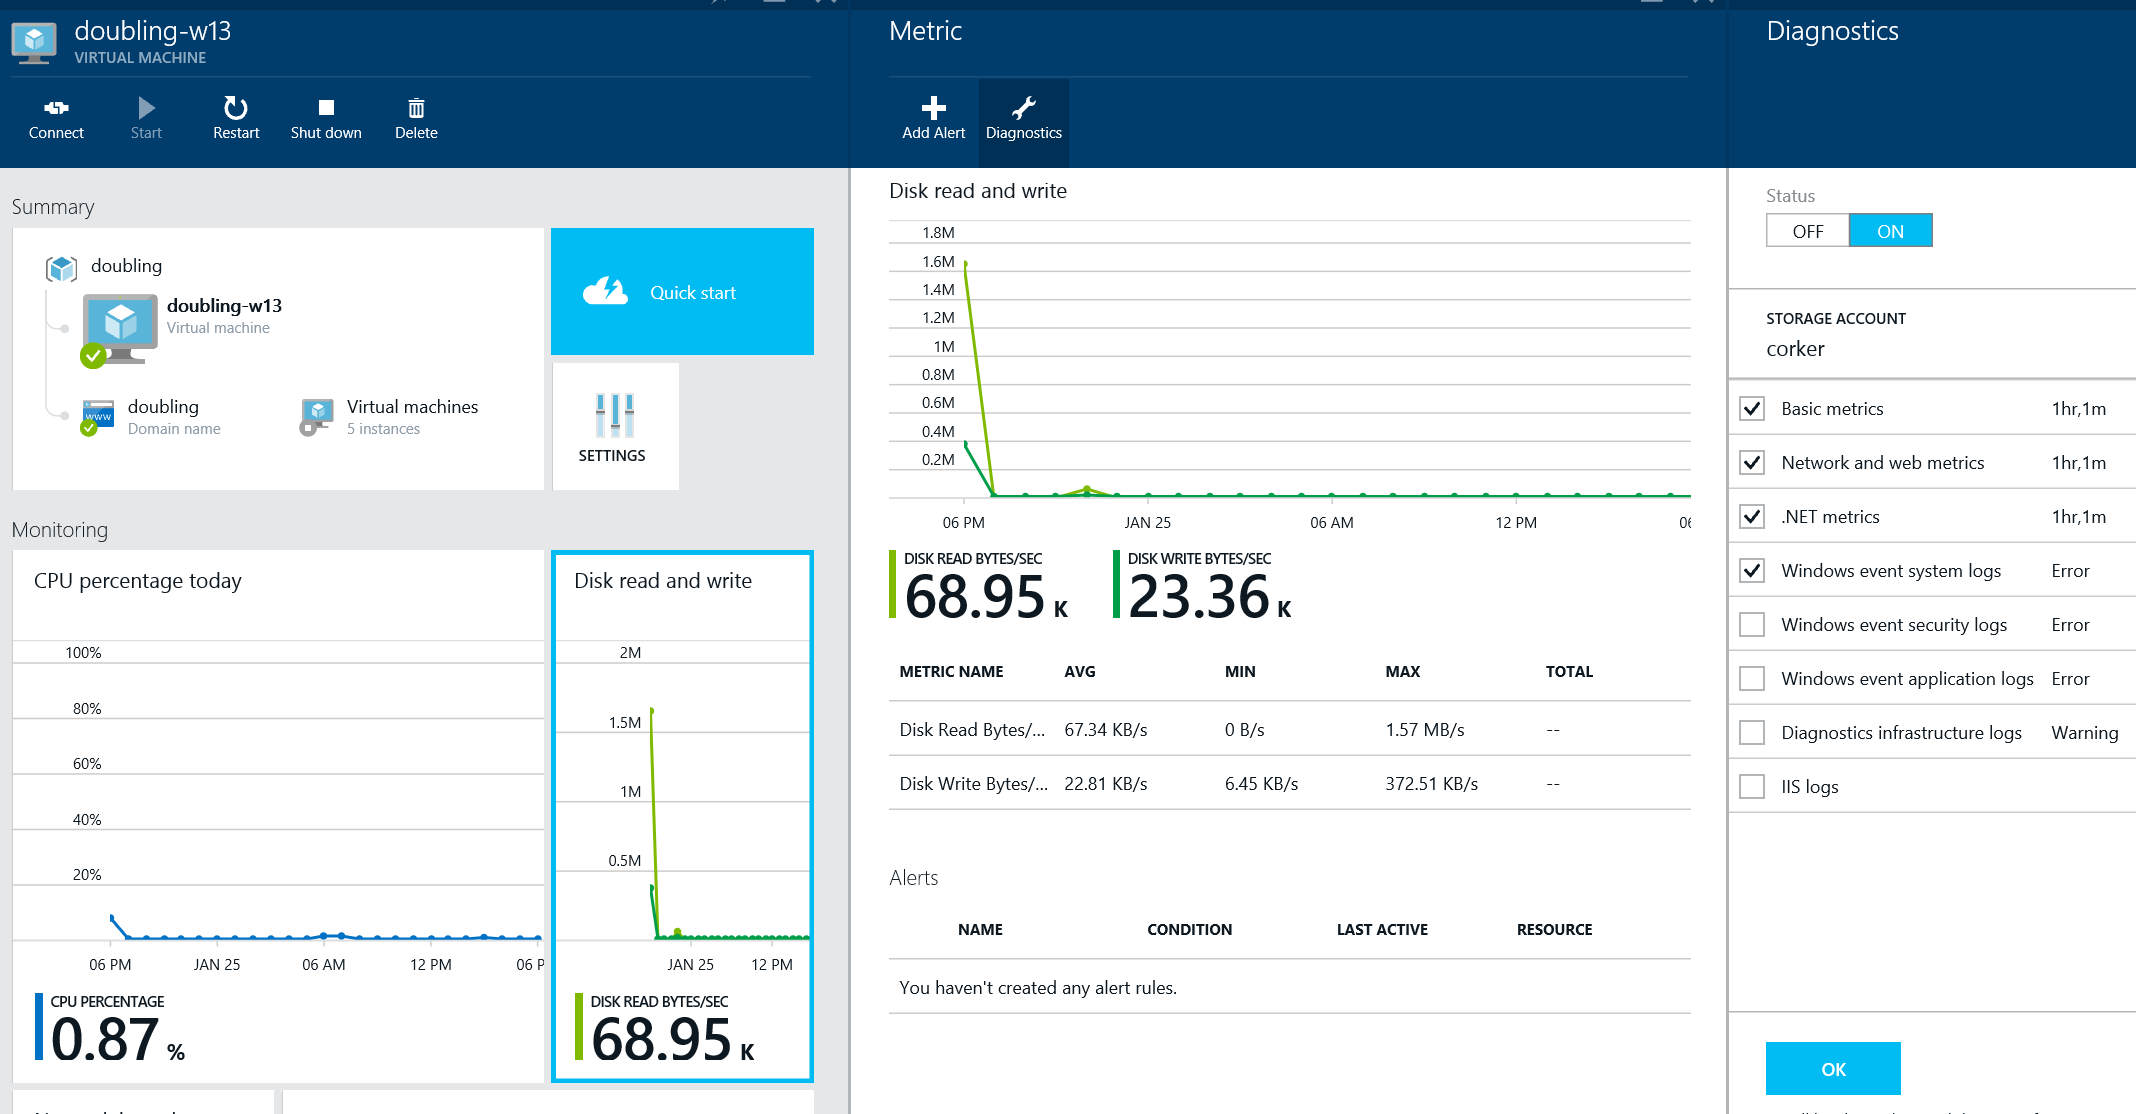
By default, the preview Azure Portal displays the following charts in the Monitoring lens of a Virtual Machine blade: CPU percentage today; Network in and out; Disk read and write. Right clicking on a chart and selecting the “Edit charts” menu item allows the selection of other performance counters to display on that chart. The preview Azure Portal UI can be used to clone individual parts of the monitoring lens allowing additional charts to be displayed on the Monitoring lens.
PowerShell Cmdlets
The Azure PowerShell cmdlets can be used to configure Azure Diagnostics on a VM – providing increased flexibility over that provided in the preview Azure Portal. The PowerShell cmdlets make direct use of the Azure Diagnostics configuration file that is deployed to each VM to control the diagnostics agent. A diagnostic configuration file can be hand-crafted to capture and persist precisely the information required.
The following PowerShell cmdlets are used to manage the Azure Diagnostics configuration for a VM:
- Get-AzureVMDiagnosticsExtension
- Set-AzureVMDiagnosticsExtension
- Remove-AzureVMDiagnosticsExtension (Not implemented)
Set-AzureVMDiagnosticsExtension updates the current Azure Diagnostic file for the specified VM. If Azure Diagnostics is not currently installed, Set-AzureVMDiagnosticsExtension also installs the Azure Diagnostics agent. Get-AzureVMDiagnosticsExtension retrieves the current Azure Diagnostics configuration file for the specified VM. Note that Set-AzureVMDiagnosticsExtension operates on a PowerShell VM Configuration object and only takes effect following the subsequent invocation of either New-AzureVM or Update-AzureVM using that configuration object.
The following PowerShell script demonstrates how to configure Azure Diagnostics on initial deployment of a VM:
 $imageName = Get-AzureVMImage |
 where { $_.ImageFamily -eq 'Windows Server 2012 R2 Datacenter' } |
 sort PublishedDate -Descending |
 select -ExpandProperty ImageName -First 1

$serviceName = 'SERVICE_NAME'
$vmName = 'VM_NAME'
$location = 'North Europe'
$instanceSize = 'Standard_D1'

# Prompt for credentials
$cred = Get-Credential -Message 'Enter admin credentials for the VM'
$adminUser = $cred.UserName
$password = $cred.GetNetworkCredential().Password

New-AzureService -ServiceName $serviceName -Location $location

$storageAccount = 'ACCOUNT_NAME'
$storageKey = 'ACCOUNT_KEY'
$storageContext = New-AzureStorageContext -StorageAccountName $storageAccount -StorageAccountKey $storageKey

$configPath = 'C:\SOME\PATH_TO\wadcfg.xml’

$vmConfig = New-AzureVMConfig -Name $vmName -InstanceSize $instanceSize -ImageName $imageName |
Add-AzureProvisioningConfig -Windows -AdminUsername $adminUser -Password $password |
Set-AzureVMDiagnosticsExtension -DiagnosticsConfigurationPath $configPath -StorageContext $storageContext -Version '1.*'

New-AzureVM -ServiceName $serviceName -VMs $vmConfig
This is a fairly standard script for VM creation. The novelty with regard to Azure Diagnostics is the use of Set-AzureVMDiagnosticsExtension to modify the VM configuration and the provision of a storage context to indicate the Azure Storage account that the diagnostics information is to be persisted into.
The following example demonstrates how to use Set-AzureVMDiagnosticsExtension to update the current configuration for Azure Diagnostics:
 $serviceName = 'SERVICE_NAME'
$vmName = 'VM_NAME'

$configPath = 'C:\SOME\PATH_TO_ANOTHER\wadcfg.xml'

$storageAccount = 'ACCOUNT_NAME'
$storageKey = 'ACCOUNT_KEY'
$storageContext = New-AzureStorageContext -StorageAccountName $storageAccount -StorageAccountKey $storageKey

Get-AzureVM -ServiceName $serviceName -Name $vmName |
Set-AzureVMDiagnosticsExtension -DiagnosticsConfigurationPath $configPath `
 -StorageContext $storageContext -Version '1.*' |
Update-AzureVM
The easiest way to create a configuration file is to download one of the configuration files generated by configuring Azure Diagnostics in the preview Azure Portal. This configuration file can be edited as desired and then uploaded. The configuration file can be downloaded from the VM as follows:
 $serviceName = 'SERVICE_NAME'
$vmName = 'VM_NAME'

$configPath = 'C:\PATH_TO_THE\wadcfg.xml'

$vmContext = Get-AzureVM -ServiceName $serviceName -Name $vmName

$extensionContext = Get-AzureVMDiagnosticsExtension -VM $vmContext

$publicConfiguration = $extensionContext.PublicConfiguration | ConvertFrom-Json

[System.Text.Encoding]::UTF8.GetString([System.Convert]::FromBase64String($publicConfiguration.xmlcfg)) | Out-File -Encoding utf8 -FilePath $configPath
The schema for the Azure Diagnostics configuration file is documented here. The following is an example of a minimal configuration file, providing for the capture and persistence of a single performance counter and the System event log:
 <?xml version="1.0" encoding="utf-8"?>
<PublicConfig xmlns="https://schemas.microsoft.com/ServiceHosting/2010/10/DiagnosticsConfiguration">
 <WadCfg>
 <DiagnosticMonitorConfiguration overallQuotaInMB="25000">
 <PerformanceCounters scheduledTransferPeriod="PT1M">
 <PerformanceCounterConfiguration counterSpecifier="\Processor(_Total)\% Processor Time" sampleRate="PT1M" unit="percent"><annotation displayName="Processor - total processor time" locale="en-us"/></PerformanceCounterConfiguration>
 </PerformanceCounters>
 <WindowsEventLog scheduledTransferPeriod="PT1M"><DataSource name="System!*"/></WindowsEventLog>
 <Metrics resourceId="/subscriptions/SUBSCRIPTION/resourceGroups/RESOURCE_GROUP/providers/Microsoft.ClassicCompute/virtualMachines/VM_NAME"><MetricAggregation scheduledTransferPeriod="PT1H"/><MetricAggregation scheduledTransferPeriod="PT1M"/></Metrics>
 </DiagnosticMonitorConfiguration>
 </WadCfg>
</PublicConfig>
Note that the Metrics element is present in the default configuration files downloaded from the preview Azure Portal. It must be configured with the appropriate subscription, resource group and VM name.
Azure Diagnostics Agent. If it is missing from the configuration file then only the basic charts - CPU Percentage, Network In/Out and Disk Read/Write - will be available in the preview Azure Portal.
Once deployed to a VM, the Azure Diagnostics Agent is c:\WindowsAzure\Packages\WaAppAgent.exe. The uploaded configuration is added to the latest configuration file in the C:\WindowsAzure\Config directory. The Azure Diagnostics Configuration is contained in that file in Base64-encoded form.