Understanding CPU metric data from Azure Cloud Services.
In this article we will learn how to interpret the CPU metric in both the Azure Portal as well as in the Windows Azure Diagnostic (WAD) tables and understand the differences between data in WAD tables and in Azure Portal. We have focused on the CPU as an example, but the same information can be used for other metrics as well.
Also, we are start from a point where we consider you have already gone thru How to Monitor Cloud Services and followed the steps.
Note: CPU usage as well as Data In, Data Out, Disk Read Throughput, and Disk Write Throughput are all captured by default even without enabling Azure Diagnostics (previously called WAD)
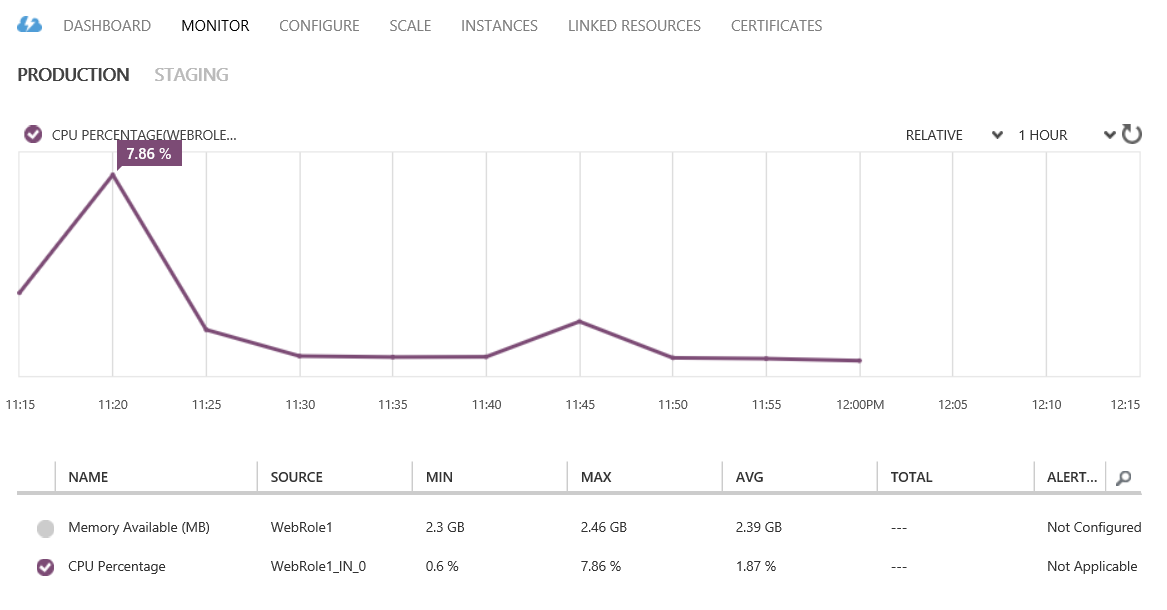
Let’s take a look at the following image which shows the Azure Portal Dashboard in the Monitor tab for Cloud Service instance called "WebRole1_IN_0" and the time zone for the Portal Screenshot is UTC-3.
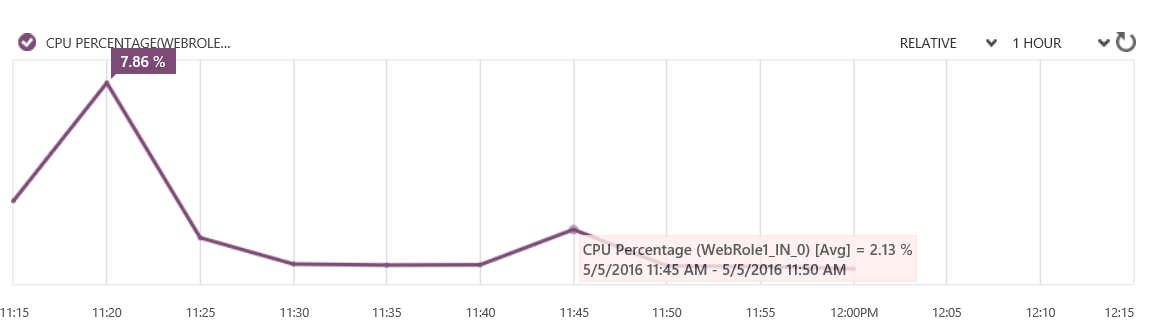
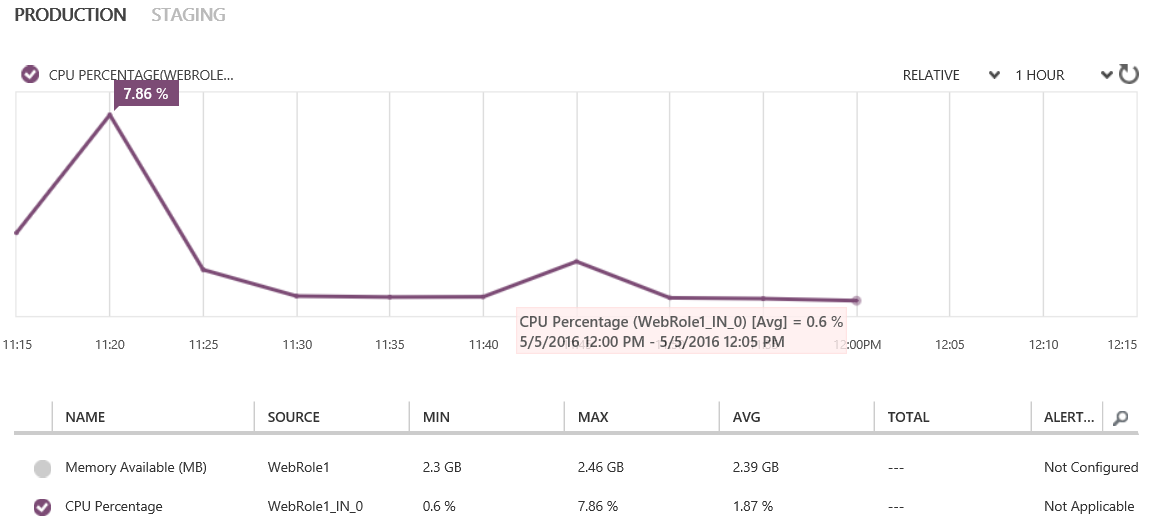
If we check in this dashboard and put the mouse pointer over 11:45am (14:45pm UTC) we can see the CPU Percentage [Avg] = 2.13% and over 12:00pm (15:00pm UTC) we can see the CPU Percentage [Avg] = 0.6%:
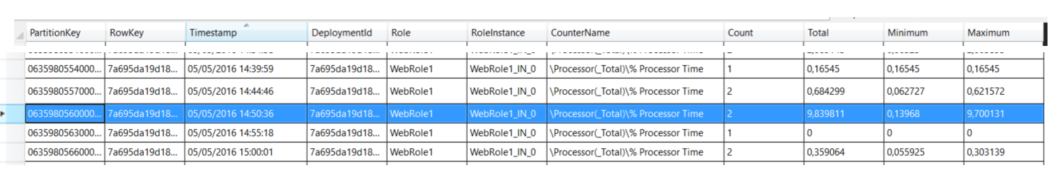
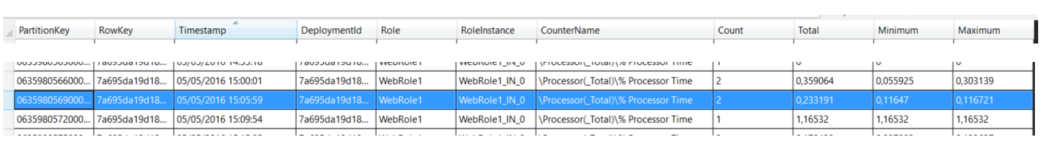
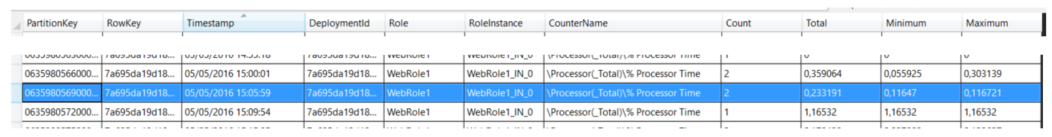
If we go to the Storage Account which is set in the WAD configuration and check the table "WAD[DeploymentID]PT5MRITable" (This table has performance counter data for 5 minutes aggregation)we see different values for total, minimum and maximum from the same counter (Screenshots from the same timestamp as the two images above respectively):
Note: In order to have performance counters data stored in WAD tables inside your Storage Account you must have Diagnostics (WAD) and Verbose monitoring enabled for your Role, otherwise you will only have the minimal metrics (CPU Percentage, Data In, Data Out, Disk Read Throughput, and Disk Write Throughput) available for the Azure Portal Dashboard only. See how to Configure monitoring for cloud services.
Note: Timestamps in WAD tables are about data from between this timestamp and the previous one and in the Portal Dashboard from between the timestamp and the one after.
So, what are those data about and why are they different? Let's analyze the second timestamp mentioned, which is between 12:00pm - 12:05pm UTC-3 (15:00pm - 15:05pm UTC).
Analysis:
The metric was taken twice in this time range of around 5 minutes (where the lower usage (minimum) of the two collections was 0.11647% and the other collection was the higher (maximum) with 0,116721% usage.
However, in the portal the data is the same, but we see a different presentation of it.

When we put the mouse pointer on any of the graphic points we can see the "percentage usage average" for the next 5 minutes, which means that what we see in the dashboard is a calculation result from performance counter data from role instances in that specific time range. In this case, the CPU had a usage average of 0.6% from 5/5/2016 12:00 PM - 5/5/2016 12:05 PM UTC-3 or 5/5/2016 15:00 PM - 5/5/2016 15:05 PM UTC. See more details from How to Monitor Cloud Services:
By default performance counter data from role instances is sampled and transferred from the role instance at 3-minute intervals. When you enable verbose monitoring, the raw performance counter data is aggregated for each role instance and across role instances for each role at intervals of 5 minutes, 1 hour, and 12 hours. The aggregated data is purged after 10 days.
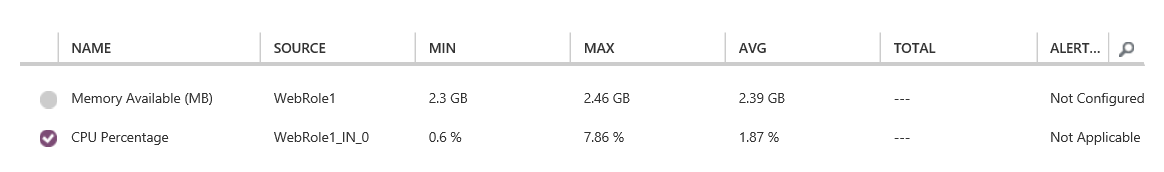
For the bottom part of the "Monitor Tab" we have the following data for counters:
- Name: Name of the Metric
- Source: Where the Metric is being taken from.
- Min: The Minimum usage average percentage (the lower value) for the whole dashboard period being presented. In this case "1 Hour"
- Max: The Maximum usage average percentage (the higher value) for the whole dashboard period being presented. In this case "1 Hour"
- AVG: The Average usage percentage for the whole dashboard period being presented. In this case "1 Hour"
- TOTAL: The total value for the whole dashboard period being presented (available for some metrics only). In this case "1 Hour"
- Alert: If you have any alert created for the specific Metric.
Conclusion: We are able to see the CPU metric as the examples above, in the Azure Dashboard as well as in WAD tables in the Storage Account (if Monitoring set to “Verbose”), however, the Metric data in WAD tables is about pictures of the performance counter data from the role and aggregated intervals of 5 minutes, 1 hour, and 12 hours, in the other hand, data in the Azure Portal Dashboard is about the same data, calculated and presented as average. So, both come from the same place, however, they are presented in different ways.
Source:
https://azure.microsoft.com/en-us/documentation/articles/cloud-services-how-to-monitor/
[bing_translator]