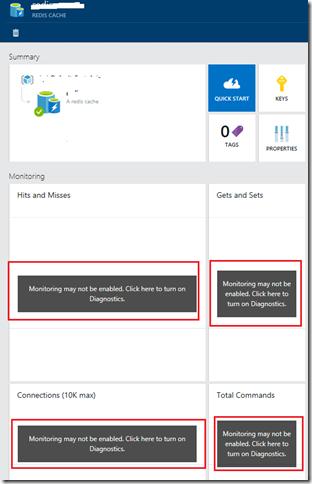
Monitoring blade in the New Portal showing 'Monitoring may not be enabled. Click here to turn on Diagnostic' for the Azure Services
Recently, it is noticed that Azure new Portal is not displaying the matrices data for the newly created Azure Services like Redis Cache or Azure Storage as expected. Instead of displaying the metrics data, it is showing a text message “Monitoring may not be enabled. Click here to turn on Diagnostic.”. We have noticed the similar behavior for multiple Azure Services, and for simplicity, I am taking Redis Cache for explain this behavior and workaround. Please note that same workaround mentioned here should be applicable to other effected services.
It seems that currently this is going to affect only for the newly created services, however, I am assuming this is going to affect for all the existing services in the future. So I am expecting there will be many other Azure customer’s will notice the similar behavior and wanted know how to get the metrics for their existing services, so thought of blog about this symptom and workaround for displaying monitoring data in the Azure New Portal ( https://portal.azure.com )
How to reproduce this behavior
1. Create a new Redis Cache Service, and click on the newly created Redis Namespace, which will launch the new blade with monitoring data similar to below screen shot
How to display the Monitoring Data
This looks like an issue caused due to moving to the new monitoring system in the Azure Backend, which basically requires an Azure Storage account for displaying the monitoring data. Please note that currently old services won’t have this issue, since old services still pull the monitoring data from the previous monitoring system, however in future once the monitoring system for these services is moved to the new one, those old services also have the similar issue. So you can get the monitoring data for the service by following below mentioned steps.
1. If you don’t have any existing storage account in the same region, where particular service is hosted, create a new storage account to the same region, where your Azure Service is located
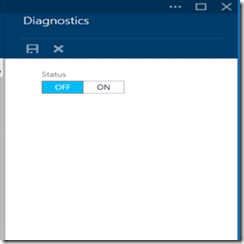
2. Click on the any one of the Monitoring part from the Portal, this will launch the new Diagnostic blade as mentioned below
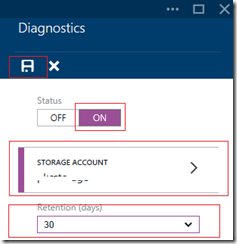
3. From the Diagnostic blade, please follow the below steps
a. Select the Status ‘ON’
b. Choose the storage account, which created in #1
c. Choose the appropriate Retention(days)
d. Click the Save button icon, and save the setting.
Hope this blog helps you in getting your metrics data for the Azure Services.


