Windows Azure Remote Debugging
Windows Azure SDK 2.2 release added support for remote debugging many types of Windows Azure resources. With remote debugging support from within Visual Studio, you are now able to have more visibility into how your code is operating live in Windows Azure and debug in-production cloud application.
What happens when you turn on remote debugging?
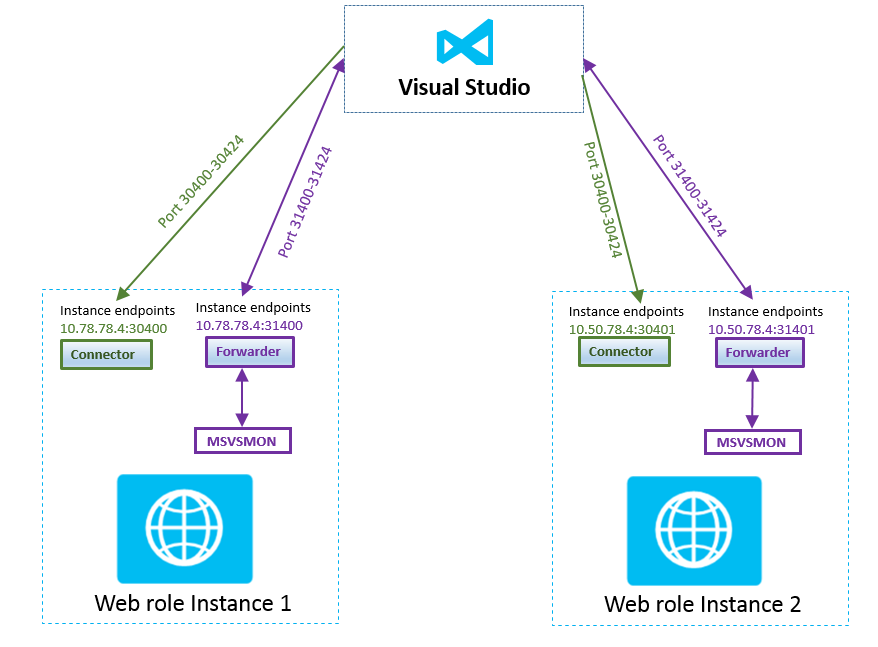
Once you turn on remote debugging, it packages the msvsmon along with other component needed to communicate and deploy it to your VM. There are two main components called connector and forwarder
Connector: The connector is the a web service which listens for commands like start the forwarder component, get processes etc.
Forwarder: The forwarder listens to an endpoint for incoming request from VS to forward it to msvsmon
You would see below configuration once you turn on remote debugging. The endpoint changes are added to the configuration file during the build. In your output directory you’ll find Cloud.build.csdef/cscfg (or similarly named) files, in which you can see what actually gets deployed. The debugger uses ports 30400-30424 and 31400-3142 and configuration looks like as below.
<ConfigurationSetting value="xxxxx" name="Microsoft.WindowsAzure.Plugins.RemoteDebugger.CertificateThumbprint"/>
<ConfigurationSetting value="true" name="Microsoft.WindowsAzure.Plugins.RemoteDebugger.Connector.Enabled"/>
<Endpoint name="Microsoft.WindowsAzure.Plugins.RemoteDebugger.Connector" protocol="tcp" publicPort="30400" port="30398" address="10.78.78.4"/>
<Endpoint name="Microsoft.WindowsAzure.Plugins.RemoteDebugger.Forwarder" protocol="tcp" publicPort="31400" port="31398" address="10.78.78.4"/>
RemoteDebugger.Connect uses instanceInputEndpoint to listens to the specified port for all instance and once receive request from Visual studio, it establish a TLS connection between VS and Remote forwarder. Remote debugging is done over a custom TLS connection, rather than via msvsmon’s built-in connection security, because msvsmon was not designed to be used over the internet. The forwarder is the server-end of that connection that listens to the endpoint for incoming request from VS and it forwards incoming traffic to the msvsmon instance running on the same box. Once the connection in established then it will hit the breakpoint in your code in VisualsStudio.
How to turn on remote debugging?
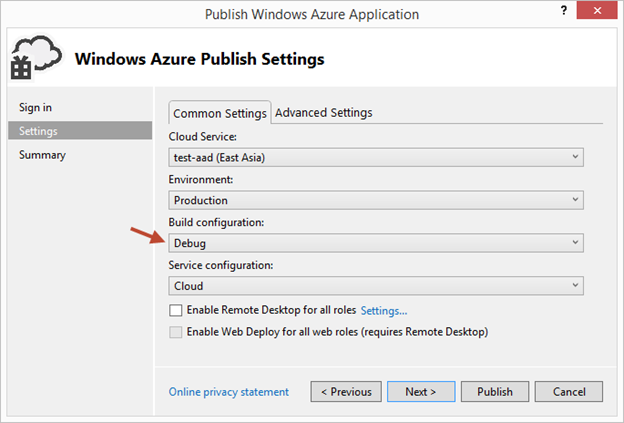
To enable remote debugging for your cloud service, select Debug as the Build Configuration on the Common Settings tab of your Cloud Service’s publish dialog wizard:
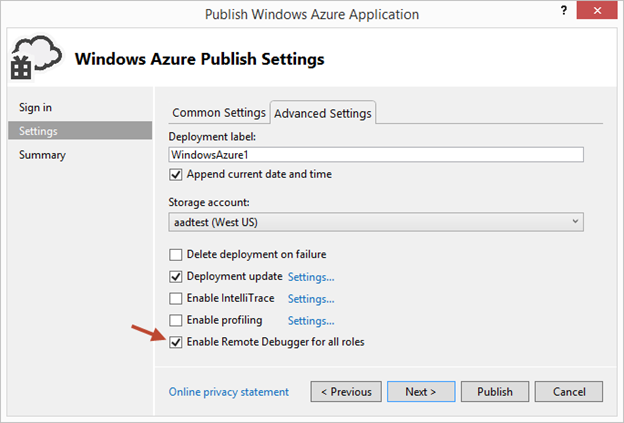
Then click the Advanced Settings tab and check the Enable Remote Debugging for all roles checkbox:
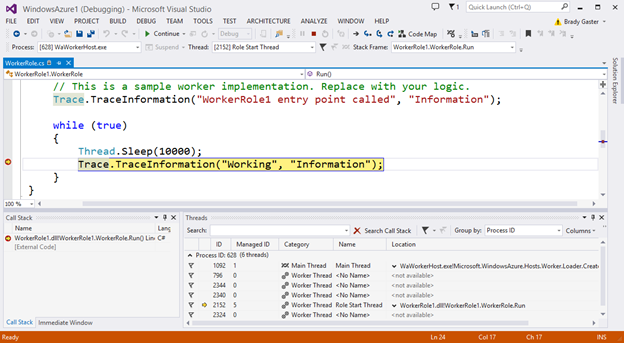
Once your cloud service is published and running live in the cloud, simply set a breakpoint in your local source code:
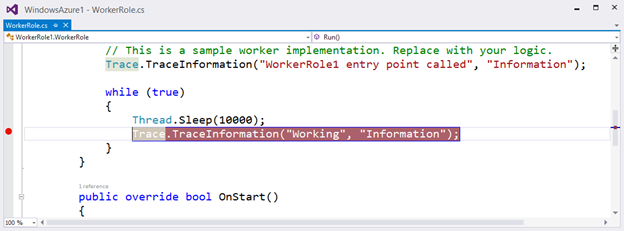
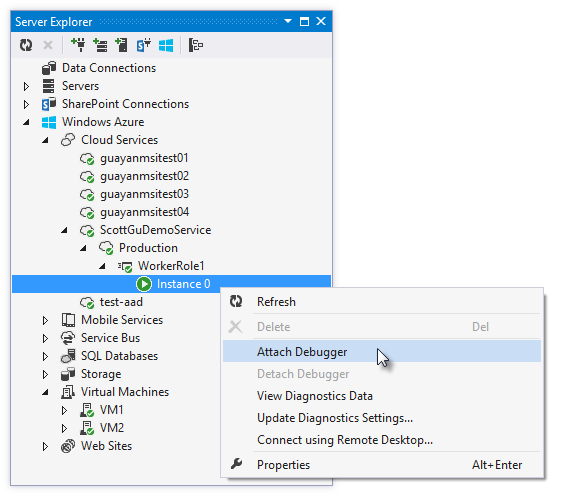
Then use Visual Studio’s Server Explorer to select the Cloud Service instance deployed in the cloud, and then use the Attach Debugger context menu on the role or to a specific VM instance of it. You can also attach multiple instance if available.
Once the debugger attaches to the Cloud Service, and a breakpoint is hit, you’ll be able to use the rich debugging capabilities of Visual Studio to debug the cloud instance remotely, in real-time, and see exactly how your app is running in the cloud.
Limitations
Instances: Publish will fail if the role has more than 25 instances.
Traffic: As the debugger communicates with Visual Studio and that Azure charges for outbound data. The data transferred is not big and shouldn’t be too big a deal.
Native debugging: For CTP tooling does not enable native debugging.
Ports: The debugger uses ports 30400-30424 and 31400-31424. If you use ports that conflict with the debugger ports you’ll see the following message: "Allocation failed. Please retry later, try reducing the VM size or number of role instances, or try deploying to a different region."
VS Restart after full deployment: If you do a full deployment and the VIP changes you need to restart VS to attach the debugger.